
USD GBP Forecast 2023: Predictions and Analysis
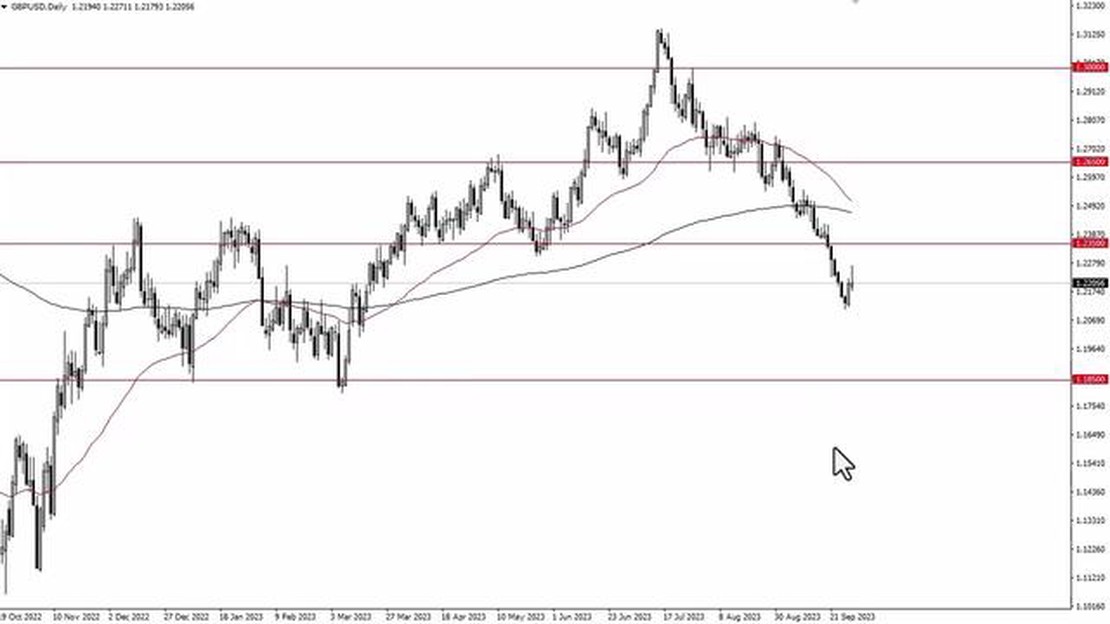
USD GBP 2023 Forecast: Predictions and Projections The USD to GBP exchange rate has been highly volatile in recent years, with fluctuations in the …
Read Article
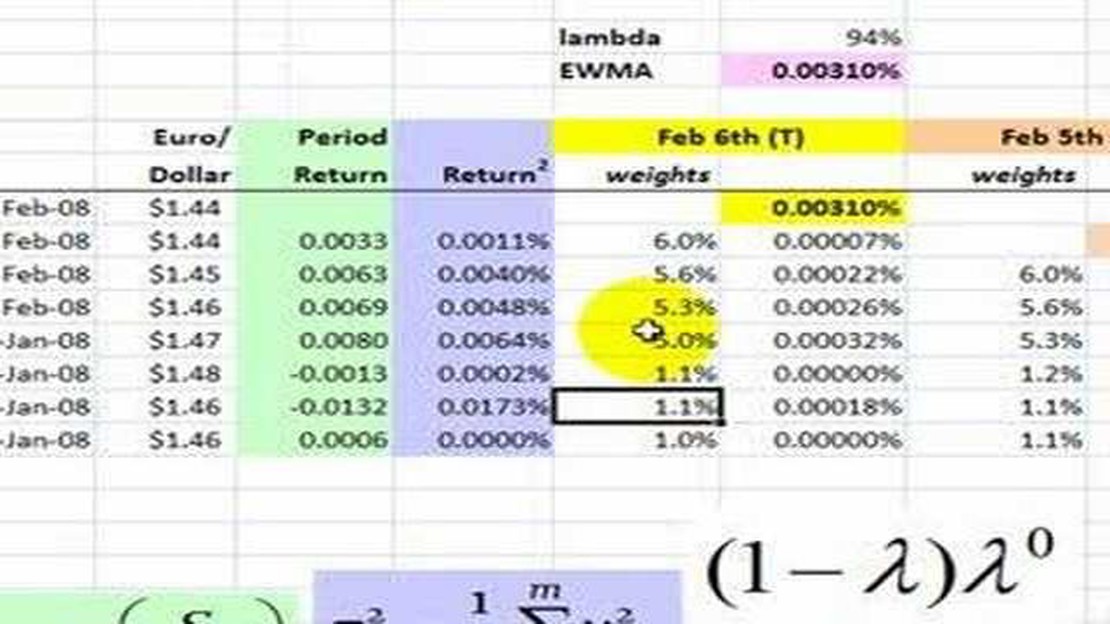
In the field of statistics and finance, the Exponentially Weighted Moving Average (EWMA) is a popular method used to analyze time series data. It is a calculation that gives more weight to recent data points while gradually decreasing the weight of older data points. This makes it particularly useful in forecasting and trend analysis.
The EWMA is often used to smooth out noisy or erratic data, helping to identify underlying patterns and trends. It is commonly used in financial markets to analyze stock prices, as well as in other fields such as weather forecasting and quality control.
To calculate the EWMA, you will need the following information: the time series data you want to analyze, a smoothing factor (often denoted as α), and an initial value (often denoted as S0). The smoothing factor determines the weight given to each data point, with higher values giving more weight to recent data.
The formula for calculating the EWMA is as follows: EWMAt = α * Yt + (1-α) * EWMAt-1, where EWMAt is the exponentially weighted moving average at time t, Yt is the data point at time t, and EWMAt-1 is the exponentially weighted moving average at time t-1. The initial value EWMAt-1 is typically set to the first data point in the series.
To calculate the EWMA, follow these steps:
Keep in mind that the choice of smoothing factor will affect the responsiveness of the EWMA to changes in the data. Higher values of α will give more weight to recent data, making the EWMA more sensitive to changes. Conversely, lower values of α will give more weight to older data, making the EWMA less sensitive to changes.
By following these steps, you can effectively calculate and utilize the Exponentially Weighted Moving Average to analyze time series data and identify meaningful trends. This technique can be particularly useful for financial analysts, economists, and researchers working with time-dependent data.

The Exponentially Weighted Moving Average (EWMA) is a statistical calculation that assigns exponentially decreasing weights to older data points in a time series. It is commonly used to smooth out noisy or erratic data and to identify trends and patterns over time.
In an EWMA calculation, each data point is multiplied by a weight, which is derived from a smoothing factor. The smoothing factor determines the rate at which the weights decrease as the data points get older. The larger the smoothing factor, the faster the weights decrease, and the more recent the data points have a higher impact on the calculation. Conversely, a smaller smoothing factor results in a slower decrease of weights, giving more weight to older data points.
EWMA is particularly useful in financial analysis and forecasting, where it is used to calculate moving averages of stock prices, returns, or other financial indicators. It can also be applied to other types of time series data, such as sales figures, temperature readings, or website traffic.
One of the key advantages of EWMA is its ability to adapt to changing trends and seasonality in the data. By assigning higher weights to recent data points, the calculation captures the most recent changes in the data, allowing for more accurate trend analysis and forecasting.
The EWMA formula can be expressed as:
Read Also: Understanding the Concept of Stock Option Grants: A Comprehensive Guide
EMAt = (1 - α) * EMAt-1 + α * xt
Where:
Read Also: USD to INR: Current exchange rate of $1 US Dollar to Indian Rupee
By using this formula, the EWMA calculation combines the previous moving average value with the current data point, according to their respective weights determined by the smoothing factor. The result is a smoothed time series that reflects the overall trend of the data while reducing the impact of noise or outliers.
To calculate the exponentially weighted moving average (EWMA), you first need to determine the smoothing constant. The smoothing constant, denoted by the symbol α, controls the weight given to each observation in the calculation.
The smoothing constant is a value between 0 and 1, and it determines the rate at which older observations depreciate relative to newer observations. A smaller value for the smoothing constant gives more weight to older observations, while a larger value gives more weight to newer observations.
To calculate the smoothing constant, you can use the following formula:
α = 2 / (N + 1)

Where N is the number of periods you want to include in the EWMA calculation. Typically, N is chosen based on the data and the desired level of responsiveness. A smaller value for N makes the EWMA more responsive to recent observations, while a larger value makes it less responsive.
Once you have determined the smoothing constant, you can proceed to the next step of calculating the EWMA.
An exponentially weighted moving average (EWMA) is a type of moving average that places more weight on recent data points, making it responsive to changes in the underlying trend. It is widely used in finance, economics, and statistics.
The EWMA is calculated by multiplying each data point by a weight factor and summing them up. The weight factor is typically determined using a decay factor, which determines how much weight is given to recent data points compared to older ones.
The EWMA is used in financial analysis because it provides a better way to track the underlying trend of a time series data, especially when the data is volatile or subject to sudden changes. It helps to smoothen out the noise and focus on the overall direction of the data.
There is no one-size-fits-all answer to finding the optimal decay factor for the EWMA. It depends on the specific application and the desired responsiveness to changes in the data. In general, a higher decay factor will give more weight to recent data points, while a lower decay factor will give more weight to older data points. Experimentation and analysis of the data are often needed to find the optimal decay factor.

USD GBP 2023 Forecast: Predictions and Projections The USD to GBP exchange rate has been highly volatile in recent years, with fluctuations in the …
Read Article
Understanding Psychology Trading: A Comprehensive Guide Trading in the financial markets is not just about analyzing charts and identifying trends. It …
Read Article
Understanding the Weekly Moving Average Concept The weekly moving average is a popular technical analysis tool used by traders and investors to …
Read Article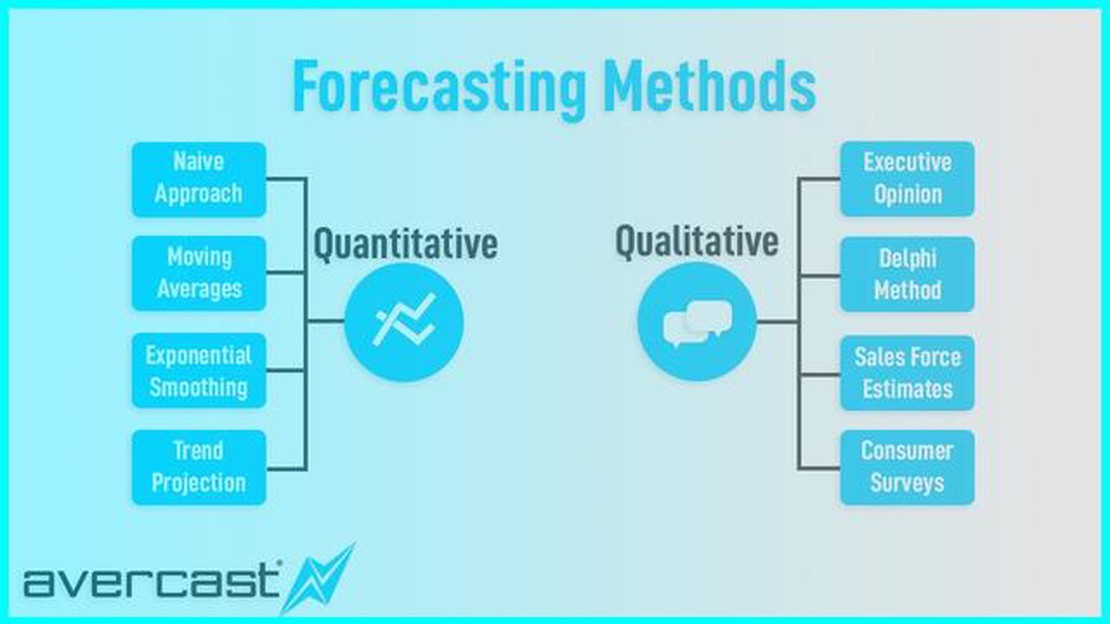
Methods for Sales Forecasting Accurate sales forecasting and revenue prediction are crucial for the success of any business. Properly anticipating …
Read Article
Is Accepting Phantom Stock a Good Choice? In today’s competitive job market, companies are constantly looking for innovative ways to attract and …
Read Article
The impact of Vega in options Options trading is a complex and dynamic field, with many different factors influencing the value and profitability of …
Read Article


