


Discover the Best Sources for Forex News and Stay Informed
Best sources for forex news Forex trading is a fast-paced and dynamic market, where staying informed about the latest developments is crucial for …
Read Article
When it comes to technical analysis in the financial markets, one of the most widely used indicators is the moving average. The moving average is a simple yet powerful tool that can help traders and investors identify trends, spot potential reversals, and make informed decisions.
The moving average is a calculation that is based on the average price of a security over a specific period of time. It is called a “moving” average because it is constantly updated as new data becomes available, and it “moves” with the price action. By smoothing out the price data, the moving average helps to eliminate noise and highlight the underlying trend.
The moving average can be used in various ways, depending on the trader’s or investor’s objectives. For example, it can be used to determine the overall direction of the market by comparing the price to the moving average. If the price is consistently above the moving average, it indicates an uptrend, while if the price is consistently below the moving average, it indicates a downtrend.
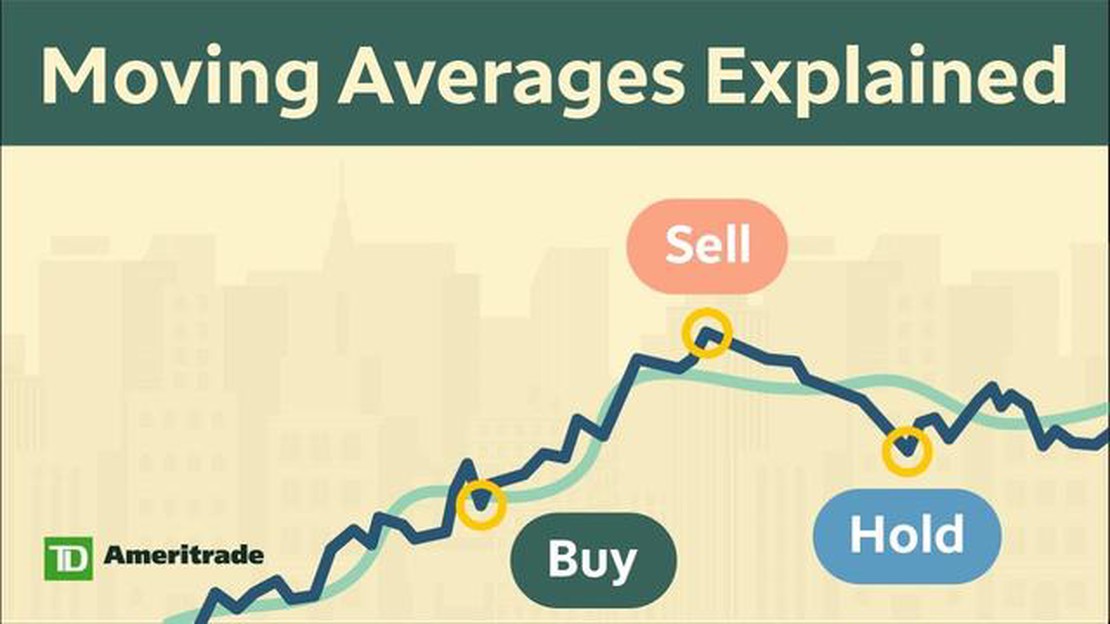
In addition to identifying trends, the moving average can also be used to generate trading signals. For example, when the price crosses above the moving average, it can be seen as a bullish signal, suggesting that it may be a good time to buy. On the other hand, when the price crosses below the moving average, it can be seen as a bearish signal, suggesting that it may be a good time to sell.
It’s important to note that the moving average is a lagging indicator, which means that it is based on past price data and may not always accurately predict future price movements. However, when used in conjunction with other technical analysis tools and indicators, the moving average can be a valuable tool in the trader’s toolkit.
The moving average indicator is a popular tool used by traders and analysts to identify trends and generate trading signals. It is a technical analysis tool that calculates the average price of a given security over a specific period of time. By smoothing out price fluctuations, the moving average can help traders identify the overall direction of a market.
The moving average can be used in various ways, but its primary function is to identify trend reversals. When the price of a security crosses above the moving average, it is often seen as a bullish signal, suggesting that the trend is shifting from a downtrend to an uptrend. Similarly, when the price crosses below the moving average, it is considered a bearish signal, indicating a shift from an uptrend to a downtrend.

There are different types of moving averages, including the simple moving average (SMA) and the exponential moving average (EMA). The SMA calculates the average price over a specific time period by summing up the prices and dividing by the number of periods. The EMA, on the other hand, gives more weight to recent prices, making it more responsive to changes in the market.
The choice of which moving average to use depends on the trader’s preferences and trading strategy. Some traders prefer the simplicity of the SMA, while others opt for the responsiveness of the EMA. It is important to note that moving averages are not predictive in nature and should be used in conjunction with other technical indicators and fundamental analysis.
In conclusion, the moving average indicator is a valuable tool for traders and analysts to identify trends and generate trading signals. By smoothing out price fluctuations, it helps traders determine the overall direction of a market and potentially profit from trend reversals. However, it should be used in conjunction with other tools and analysis to make informed trading decisions.
The moving average indicator is a commonly used technical analysis tool that helps traders determine the overall trend of an asset’s price over a specific period of time. It is based on the concept that prices tend to move in trends, and by analyzing these trends, traders can make more informed decisions about buying or selling.
Read Also: How to Land a Job at a Hedge Fund: Essential Tips and Strategies
The moving average indicator calculates the average price of an asset over a specified number of periods. The most commonly used periods are 50, 100, and 200 days, although traders can customize the period based on their preferences and trading strategy.
The indicator is called “moving average” because it continually adjusts as new price data becomes available. As each new period is added, the oldest period is dropped, and the calculation is updated to reflect the latest prices.
Read Also: What is the price target for B2Gold? | Latest analysis and forecasts
There are two main types of moving averages: the simple moving average (SMA) and the exponential moving average (EMA). The SMA gives equal weight to each period in the calculation, while the EMA gives more weight to recent prices. Traders often use the SMA for long-term trends and the EMA for short-term trends.
Traders use the moving average indicator in various ways. Firstly, it can be used to determine the overall trend of an asset’s price. If the current price is above the moving average line, it indicates an uptrend, while if the price is below the moving average line, it indicates a downtrend.
In addition to determining the trend, the moving average indicator can also be used to generate buy and sell signals. When the price crosses above the moving average line, it generates a buy signal, while when the price crosses below the moving average line, it generates a sell signal.
Overall, the moving average indicator is a versatile and widely used tool in technical analysis. By understanding its calculation and how to interpret its signals, traders can gain valuable insights into market trends and make more informed trading decisions.

The moving average indicator is a popular technical analysis tool that helps to identify trends in the price of an asset by smoothing out fluctuations in the data. It calculates the average price over a specific period of time, which is then plotted on a chart to show the overall direction of the price movement.
The moving average indicator works by calculating the average price of an asset over a certain number of time periods. It then plots this average on a chart, creating a line that moves along with the price of the asset. By smoothing out short-term price fluctuations, the indicator helps to identify the overall trend of the asset.
There are several types of moving averages, including simple moving averages (SMA), exponential moving averages (EMA), and weighted moving averages (WMA). The SMA calculates the average price over a specific number of periods, while the EMA gives more weight to recent data. The WMA assigns different weights to each period, with more weight given to the most recent data.
The moving average indicator can be used in various ways. Traders often use it to identify trends and determine entry or exit points for trades. For example, if the price of an asset is consistently above the moving average line, it may indicate an uptrend and a good time to buy. Conversely, if the price drops below the moving average line, it may signal a downtrend and a possible time to sell.
The moving average indicator can be used alone, but it is often used in conjunction with other technical analysis tools to confirm signals and provide more accurate predictions. For example, traders may combine the moving average indicator with other indicators, such as the Relative Strength Index (RSI) or the Moving Average Convergence Divergence (MACD), to get a more complete picture of the market.
The Moving Average (MA) indicator is a widely used technical analysis tool that calculates the average price of a security over a specified period of time.

Best sources for forex news Forex trading is a fast-paced and dynamic market, where staying informed about the latest developments is crucial for …
Read Article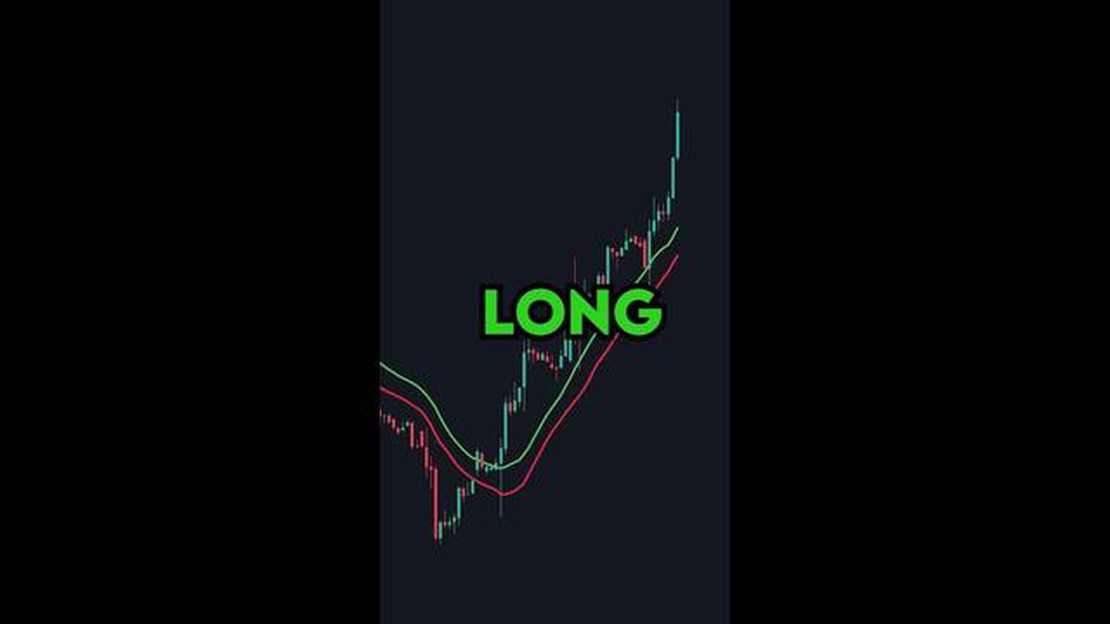
What is the 2 term moving average? When it comes to analyzing data over a period of time, one common method used is the moving average. This …
Read Article
Cost of $1000 in Moscow: Prices and Currency Exchange Rates Moscow, the capital city of Russia, is known for its rich history, breathtaking …
Read Article
Buy Rate for India to USD Are you planning to travel to India or involved in any business transactions with the Indian market? It is essential to stay …
Read Article
Is MT5 Legal in the US? MetaTrader 5 (MT5) is a popular trading platform used by traders around the world. However, when it comes to trading in the …
Read Article
1 RM to 1 RMB Exchange Rate If you’re planning a trip to China or Malaysia, or if you simply need to exchange your currency, it’s important to know …
Read Article


