


Discover the Most Effective Strategy for 1-Minute Trading
Discover the Most Effective Strategy for 1-Minute Trading Are you ready to take your trading skills to the next level? If you have ever been curious …
Read Article
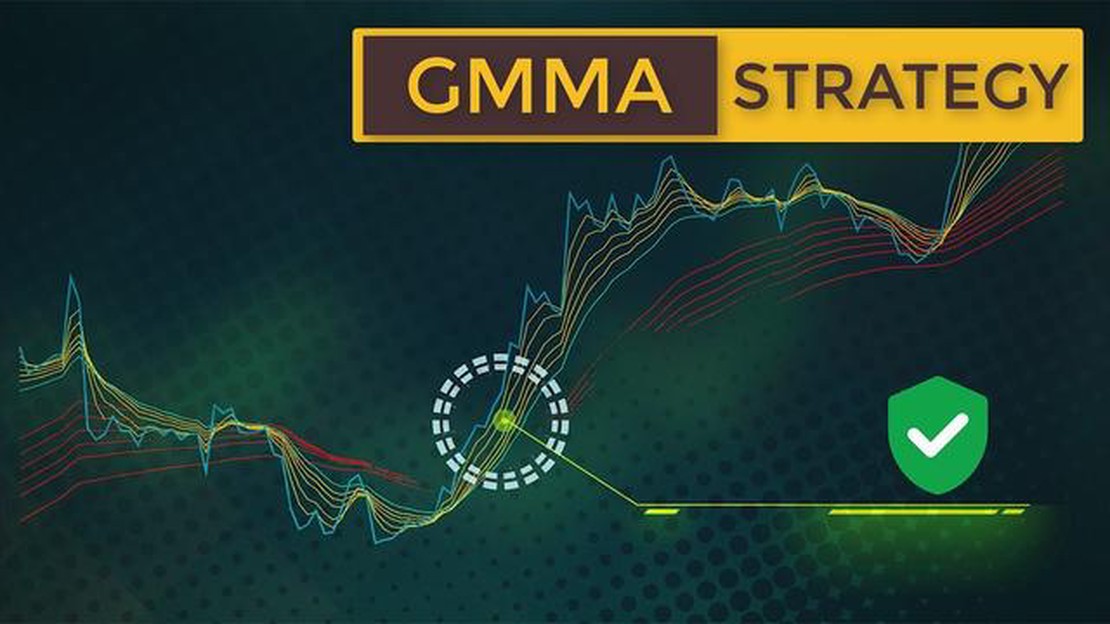
The Guppy Multiple Moving Average (GMMA) is a popular technical analysis indicator used in trading to identify trends and potential price reversals. It was developed by Daryl Guppy, an Australian trader and author, and is widely used by both novice and experienced traders.
The GMMA consists of two sets of moving averages: the short-term group and the long-term group. The short-term group includes moving averages of shorter time periods, such as 3, 5, 8, or 10, while the long-term group includes moving averages of longer time periods, such as 30, 35, 40, or 45.
The GMMA indicator is plotted on the price chart and consists of multiple lines, each representing one moving average. The short-term group lines are plotted closer to the current price, while the long-term group lines are plotted further away. This visual representation allows traders to quickly assess the strength and direction of the trend.
When the short-term group of moving averages is positioned above the long-term group, it indicates a bullish trend, suggesting that prices are likely to continue rising. Conversely, when the short-term group is positioned below the long-term group, it signals a bearish trend, indicating that prices are likely to continue falling. Traders often look for crossovers between the short-term and long-term group lines as a confirmation of a potential trend reversal.
In addition to identifying trends, the GMMA indicator can also be used to determine support and resistance levels. When prices pull back and touch the long-term group lines, they often find support and bounce back up. Conversely, when prices rally and touch the short-term group lines, they often encounter resistance and pull back.

Overall, the GMMA indicator is a valuable tool for traders as it provides a comprehensive view of the market, combining both short-term and long-term trends. By understanding and interpreting the signals given by the GMMA indicator, traders can make more informed trading decisions and increase their chances of success.
The Guppy Multiple Moving Average (GMMA) indicator is a popular technical analysis tool used by traders to identify trends and potential reversal points in the financial markets. It combines multiple moving averages into one indicator, providing a comprehensive view of price action.
The GMMA indicator consists of two sets of moving averages, known as the short-term and long-term group. The short-term group typically consists of three moving averages, while the long-term group consists of five moving averages. Each moving average in both groups is calculated using different time periods, allowing traders to capture both short-term and long-term trends.
The short-term group of moving averages helps traders identify short-term price movements, while the long-term group of moving averages focuses on long-term trends. The intersection and divergence of these two groups can provide valuable insights into market sentiment and potential trading opportunities.
When the short-term moving averages are above the long-term moving averages, it suggests that the market is in an uptrend. Conversely, when the short-term moving averages are below the long-term moving averages, it indicates a downtrend. The wider the gap between the two groups, the stronger the trend.
In addition to identifying trends, the GMMA indicator can also signal potential reversal points. This is done by observing the convergence or divergence of the moving averages within each group. When the moving averages within one group start to converge, it suggests a potential trend reversal. Similarly, when the moving averages start to diverge, it indicates a continuation of the current trend.
Read Also: What is the limit of IDBI Visa card? All you need to know
Traders can use the GMMA indicator in conjunction with other technical analysis tools and indicators to confirm trade signals and make informed trading decisions. It is important to note that no single indicator can guarantee profitable trades, and it is always recommended to conduct thorough analysis and risk management before entering any trades.
In conclusion, the Guppy Multiple Moving Average Indicator is a powerful tool for traders to identify trends and potential reversal points in the financial markets. It combines multiple moving averages into one indicator, providing a comprehensive view of price action. Traders can use this indicator to make informed trading decisions, but it should be used in conjunction with other analysis tools to confirm trade signals and manage risk effectively.
Read Also: Why Do Most Option Traders Fail? Learn the Common Mistakes and How to Succeed
The Guppy Multiple Moving Average (GMMA) indicator is a technical analysis tool that consists of two sets of moving averages. The first set is the short-term moving averages, which typically includes 3, 5, 8, 10, 12, and 15-day moving averages. The second set is the long-term moving averages, which usually consists of 30, 35, 40, 45, 50, and 60-day moving averages.
The purpose of the GMMA indicator is to identify periods of consolidation and trends in the market. It helps traders to understand the overall market sentiment and make informed trading decisions. The short-term moving averages represent the actions of short-term traders, while the long-term moving averages represent the actions of long-term traders. By observing the interaction between these two sets of moving averages, traders can gain insights into the market dynamics.
When the short-term moving averages start to converge and move closer together, it indicates a period of consolidation or indecision in the market. This could be a signal for traders to stay out of the market or reduce their positions. On the other hand, when the short-term moving averages start to diverge and move further apart, it indicates a period of strong trend or momentum in the market. This could be a signal for traders to enter or add to their positions.
The GMMA indicator can also be used to identify potential trend reversals. When the short-term moving averages cross above the long-term moving averages, it could signal a bullish trend reversal. Conversely, when the short-term moving averages cross below the long-term moving averages, it could signal a bearish trend reversal. Traders can use these signals to exit or reverse their positions.
Overall, the GMMA indicator provides traders with a visual representation of the market’s behavior and helps them to analyze the current market conditions. It is a useful tool for both short-term and long-term traders in their decision-making process.
The Guppy Multiple Moving Average Indicator is a technical analysis tool used to identify trends and their strength in financial markets. It consists of multiple exponential moving averages of different time periods.

The indicator works by plotting multiple exponential moving averages on a price chart. These moving averages are color-coded to make it easy to identify the different trends. Traders look for crossovers, divergences, and the relationship between the moving averages to determine the trend and its strength.
The Guppy Multiple Moving Average Indicator uses a combination of short-term, medium-term, and long-term exponential moving averages. The most common set of moving averages used is 3, 5, 8, 10, 12, 15, 30, 35, 40, 45, 50, and 60 periods. However, traders can customize the indicator by choosing their own set of moving averages.
The Guppy Multiple Moving Average Indicator provides several advantages. It helps identify trends early, provides a clear visual representation of trend strength, and reduces false signals. The color-coding of the moving averages makes it easy to interpret the chart. Additionally, traders can use the indicator in combination with other technical analysis tools to increase the probability of successful trades.
Yes, the Guppy Multiple Moving Average Indicator can be used in all financial markets, including stocks, commodities, forex, and cryptocurrencies. It is a versatile indicator that can be applied to different time frames, from intraday to long-term charts.

Discover the Most Effective Strategy for 1-Minute Trading Are you ready to take your trading skills to the next level? If you have ever been curious …
Read Article
Trading High and Low in Forex: Strategies and Tips Forex trading, also known as foreign exchange trading, is a popular financial market where traders …
Read Article
What Does It Mean to See 3 Black Crows? Throughout history, crows have been associated with various superstitious beliefs and symbolism. One …
Read Article
Understanding Authorized but not Issued Shares When it comes to understanding the intricacies of a company’s stock structure, the term “authorized but …
Read Article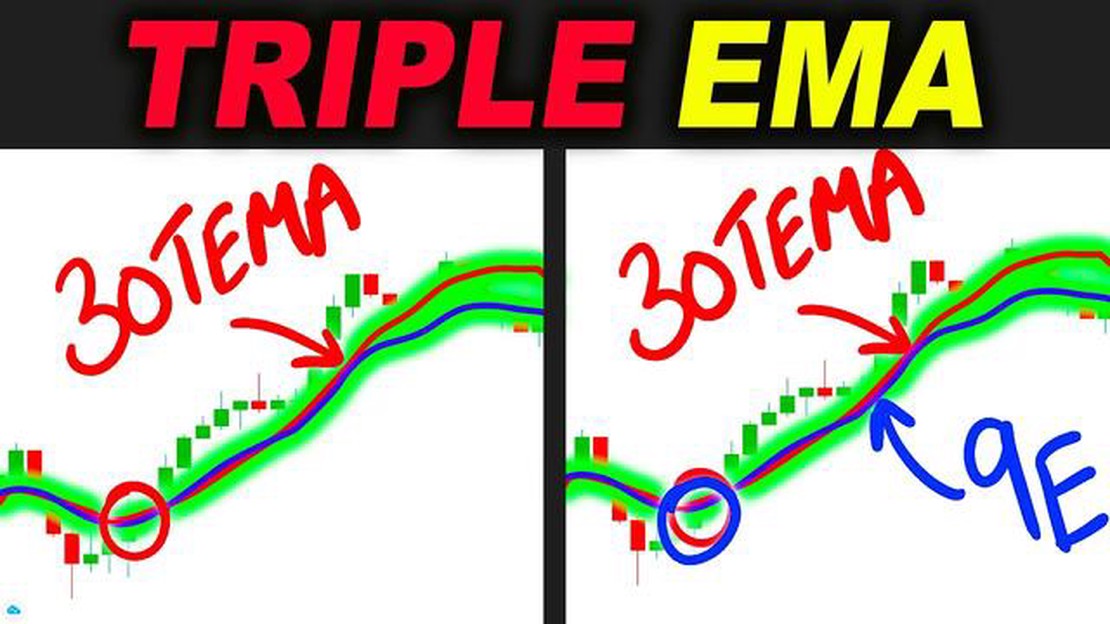
Understanding the Triple Exponential Moving Average in MT4 The Triple Exponential Moving Average (TEMA) is a technical indicator used in trading to …
Read Article
Why am I obsessed with trading? Trading can be an addictive habit that many individuals find difficult to break free from. The allure of the financial …
Read Article


