


Understanding the Short Sale Restriction Squeeze and its Impact on Markets
Understanding Short Sale Restriction Squeeze Short sale restriction squeeze is a market phenomenon that occurs when there is a sudden increase in …
Read Article
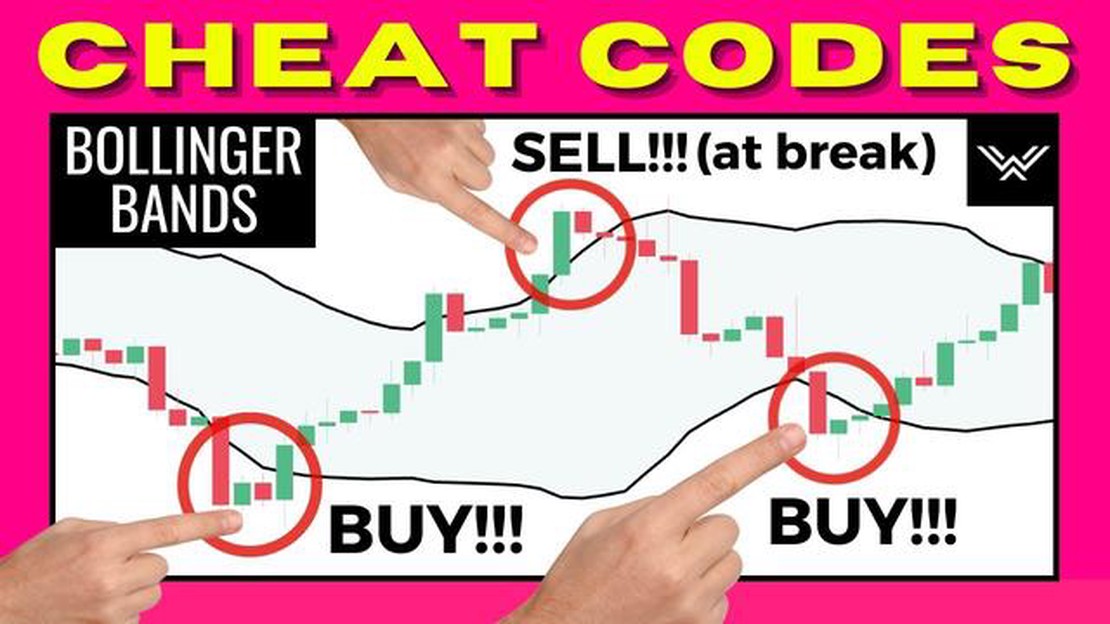
The Bollinger Bands are a popular technical analysis tool used by traders to analyze price volatility and potential price movements in financial markets. They consist of a center line, which is a simple moving average, and two outer bands that are based on standard deviations from the center line.
The double top pattern is a bearish reversal pattern that forms after an extended uptrend. It consists of two peaks that reach a similar price level, with a dip in between. This pattern is considered significant because it indicates a possible trend reversal, with the price likely to move downwards.
Combining double top pattern with Bollinger Bands can provide valuable insights into market conditions and potential trading opportunities. When the price forms a double top pattern near the upper Bollinger Band, it indicates a potential trend reversal and a possible shift in momentum from bullish to bearish.
Traders can use Bollinger Bands to confirm the formation of a double top pattern. If the second peak of the double top pattern occurs near or beyond the upper Bollinger Band, it adds confirmation to the bearish reversal signal. Additionally, if the price breaks below the lower Bollinger Band following the formation of the double top pattern, it provides further confirmation of a bearish trend.
It is important to note that no single indicator or pattern should be used in isolation. Traders should always consider other technical indicators, fundamental analysis, and market conditions before making trading decisions. However, combining the double top pattern with Bollinger Bands can be a useful tool in identifying potential trend reversals and planning entry and exit points in the market.
Bollinger Bands are a technical analysis tool that was developed by John Bollinger in the early 1980s. They are a type of trading indicator that measures the volatility and price levels in a financial market. The bands consist of three lines: a middle line that represents the moving average, and two outer lines that are placed above and below the middle line at a specified standard deviation.
The outer bands are typically set at two standard deviations away from the middle line, but these settings can be adjusted based on the trader’s preference and the specific market conditions. The purpose of the Bollinger Bands is to provide traders with a visual representation of price volatility and to help identify potential trading opportunities.
When the price is trading within the range defined by the Bollinger Bands, it is considered to be in a normal or stable state. However, when the price moves beyond the upper or lower band, it is seen as a sign of increased volatility and potential trend reversal.
The concept behind Bollinger Bands is that price tends to revert back to the middle line, creating a mean-reversion trading strategy. Traders can use the Bollinger Bands to identify potential entry and exit points for their trades. For example, when the price touches the upper band, it may be a signal to sell or take profit, while a touch of the lower band could be a signal to buy or enter a long position.

In addition to providing potential trading signals, Bollinger Bands can also help traders determine the strength of a trend. When the price consistently stays within the bands and the bands are narrow, it suggests that the market is in a period of low volatility. Conversely, when the bands widen, it indicates a period of increased volatility.
Overall, Bollinger Bands are a popular and widely used tool in technical analysis. They can help traders identify potential trading opportunities, determine entry and exit points, and gauge market volatility. However, it is important to use Bollinger Bands in conjunction with other indicators and analysis techniques to make informed trading decisions.
The double top pattern is a popular chart pattern in technical analysis that can signal a potential trend reversal. It is formed when the price of an asset moves up to a certain level, then retraces and forms a second peak at or near the same level before declining.
The first peak in the double top pattern signifies a resistance level that the price struggles to break through. After reaching this level, the price retraces, indicating a temporary exhaustion of buying pressure. However, if the buying pressure reignites and pushes the price up to form a second peak around the same level, it suggests that the resistance level is significant and can’t be easily surpassed.
Read Also: Is Xoom the Same as PayPal? Comparison and Differences
This double top pattern provides traders with a potential entry point for short positions, as it signals a reversal from an uptrend to a downtrend. Traders typically look for confirmation by observing other technical indicators, such as volume, momentum, and trend lines.
When trading the double top pattern, it’s important to set appropriate stop-loss levels to manage risk. Traders often place the stop-loss order above the second peak to protect against a potential breakout above the resistance level.
Read Also: Understanding Open Interest Liquidity for Options: A Comprehensive Guide
It’s worth noting that the double top pattern is not always a reliable signal, and traders should use it in conjunction with other tools and analysis. False breakouts and whipsaws can occur, so it’s important to have a well-defined trading strategy and proper risk management.
Overall, understanding the double top pattern can be valuable for identifying potential trend reversals and planning profitable trading strategies. With proper analysis and risk management, traders can take advantage of this chart pattern to make informed trading decisions.
The double top pattern is a popular technical analysis chart pattern that can provide important signals to traders. It is characterized by two consecutive peaks at approximately the same price level, separated by a trough. This pattern indicates a potential reversal of an uptrend and the start of a downtrend.
To identify the double top pattern, traders look for the following criteria:

Once the pattern is identified and confirmed, traders may consider entering a short position, anticipating a downward move in the price. They often set a stop loss above the second peak and a target profit level based on the height of the pattern.
It is important to note that like any other chart pattern, the double top pattern is not foolproof and should be used in conjunction with other technical indicators and analysis methods for better accuracy.
In conclusion, the double top pattern is a powerful tool for traders to identify potential reversals in the market. By understanding its characteristics and using it in combination with other technical analysis techniques, traders can make more informed trading decisions.
Bollinger Bands are a technical analysis tool that consists of an upper and lower band, as well as a middle band, which is typically a simple moving average. These bands are used to measure volatility and identify potential price reversals.
Bollinger Bands can be used to identify overbought and oversold conditions in a market. When the price reaches the upper band, it is considered overbought, and when it reaches the lower band, it is considered oversold. Traders can use this information to make decisions on entering or exiting trades.
The double top pattern is a bearish reversal pattern that occurs when a security makes two consecutive peaks that are approximately equal in price, separated by a trough. This pattern suggests that the uptrend is losing strength and that a downtrend may be imminent.
Bollinger Bands can be used to confirm the double top pattern. When the price forms the first peak, it will usually touch or go above the upper band. Then, when the price forms the second peak, it will often stay below the upper band, indicating a potential trend reversal. Traders can look for this confirmation from the Bollinger Bands before making trading decisions.

Understanding Short Sale Restriction Squeeze Short sale restriction squeeze is a market phenomenon that occurs when there is a sudden increase in …
Read Article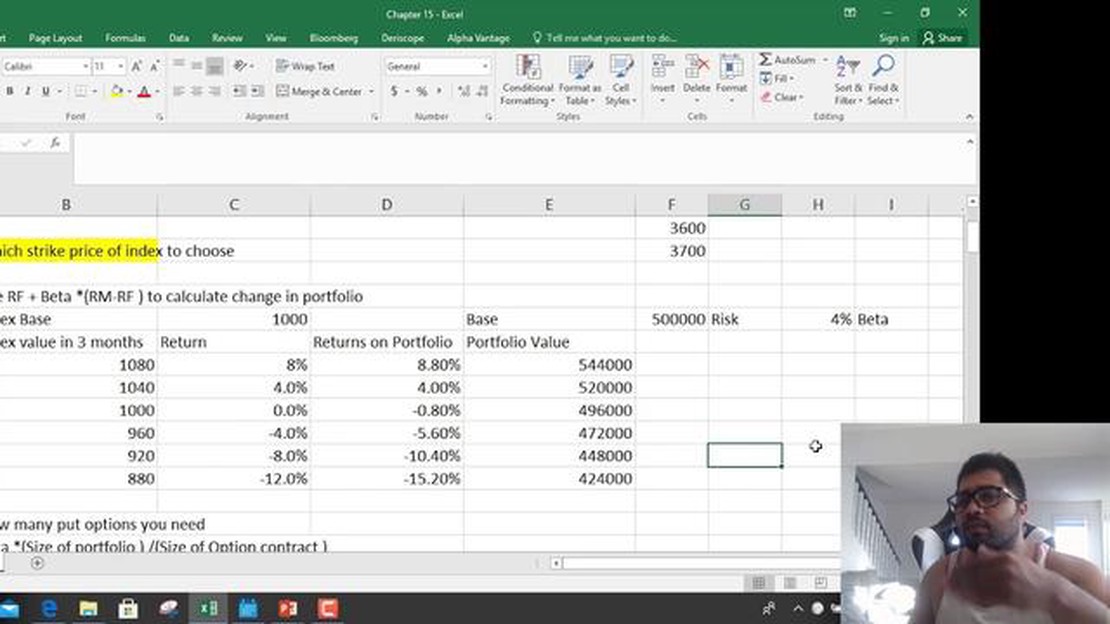
Understanding Options on Stock Indices and Currency Options on stock indices and currency are powerful financial instruments that allow investors and …
Read Article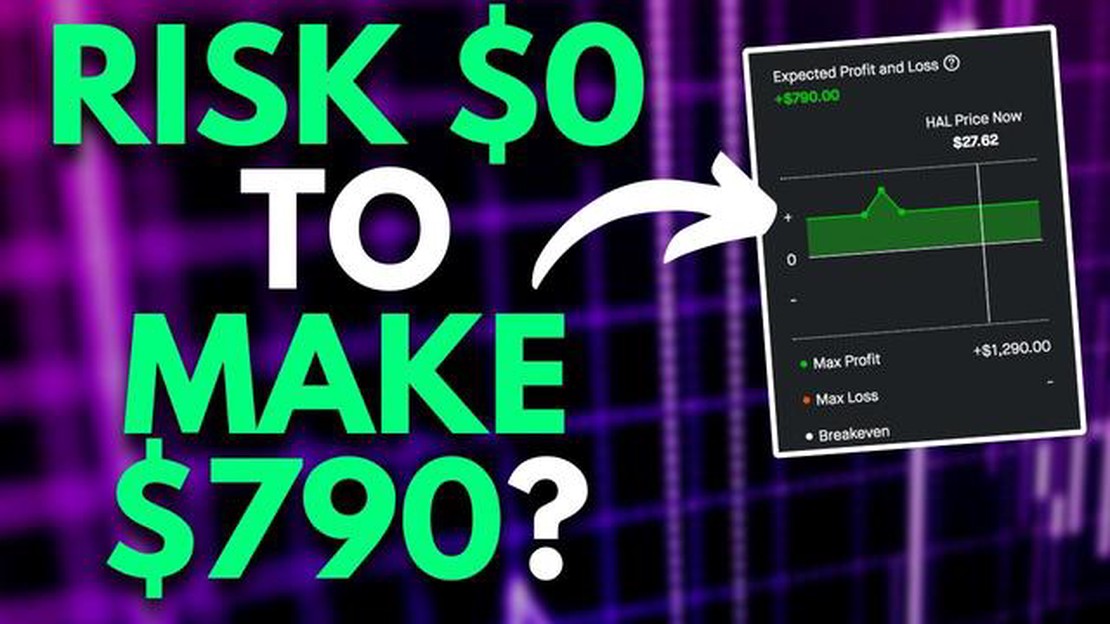
What is the zero loss method? When it comes to financial investments, minimizing losses is a top priority for investors. The Zero Loss Method is a …
Read Article
Easy Ways to Understand Forex Trading Forex, or foreign exchange, is a decentralized market for trading currencies. It is the largest and most liquid …
Read Article
Discover how JP Morgan utilized astrology in their decision-making process As one of the most influential and successful figures in finance, JP …
Read Article
What is the ideal risk per trade for a $100 forex account? When it comes to trading forex with a $100 account, determining the ideal risk percentage …
Read Article


