
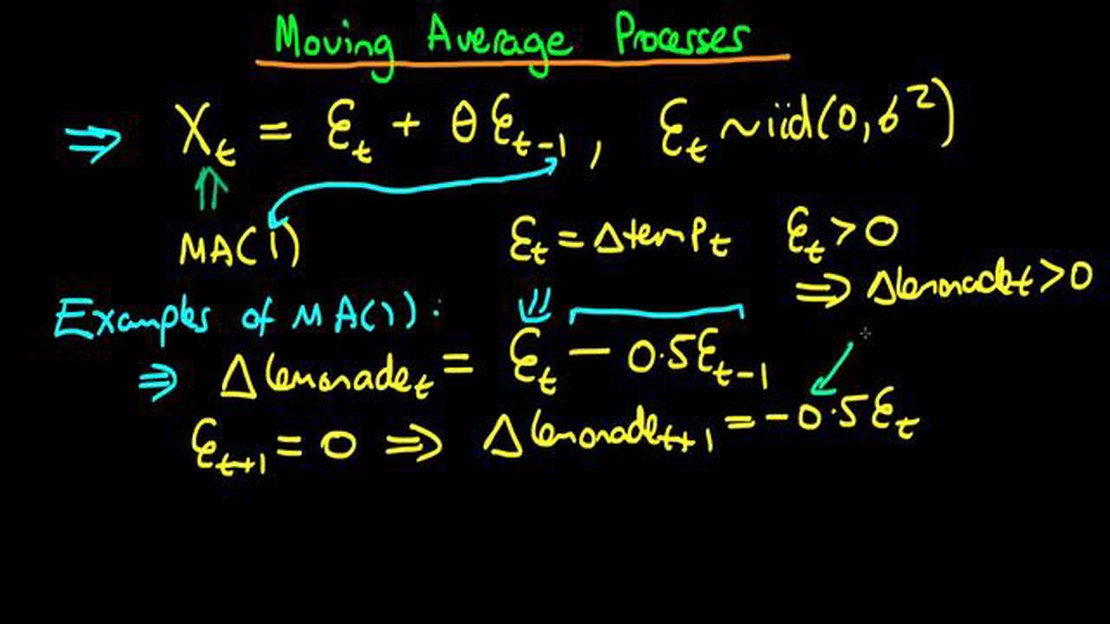

Is MA(1) stationary? Explanation and Examples
Is Ma 1 stationary? Stationarity is a fundamental concept in time series analysis. It refers to the statistical properties of a process remaining …
Read Article
The 50-day moving average is a commonly used technical analysis tool in the stock market. It is a line that represents the arithmetic mean of a stock’s closing prices over the past 50 trading days. This moving average is widely regarded as a key indicator of a stock’s short-term trend, providing insights into its overall performance and potential price movements.
Traders and investors use the 50-day moving average to identify patterns and trends, as it smooths out short-term fluctuations and noise in stock prices. It helps in filtering out market noise and focusing on the underlying trend of the stock. By comparing the stock’s current price to its 50-day moving average, traders can analyze whether the stock is trading above or below this line, indicating a bullish or bearish sentiment.
In addition to identifying the trend, the 50-day moving average also serves as a dynamic support or resistance level for a stock. When the stock price is trending above the 50-day moving average, it often acts as a support level, preventing the stock from declining further. On the other hand, when the stock price is trading below the 50-day moving average, it may act as a resistance level, preventing the stock from rising higher.
Furthermore, the 50-day moving average can be used in conjunction with other technical indicators, such as volume and other moving averages, to confirm trends and generate trading signals. It provides traders with a reference point for determining entry and exit points, helping them make more informed trading decisions.
The 50-day moving average is a technical indicator widely used in stock market analysis. It is a trend-following indicator that helps investors and traders identify the overall market trend and potential support or resistance levels.
The 50-day moving average is calculated by averaging the closing prices of a stock or an index over the past 50 trading days. Each day, the oldest price is dropped from the calculation and the most recent price is added, creating a moving average line that “moves” as new data is added and old data is dropped.
This moving average line helps smooth out short-term price fluctuations and provides a clearer picture of the stock or index’s overall direction. By focusing on a longer time frame, the 50-day moving average gives a more reliable indication of the underlying trend compared to shorter-term moving averages.
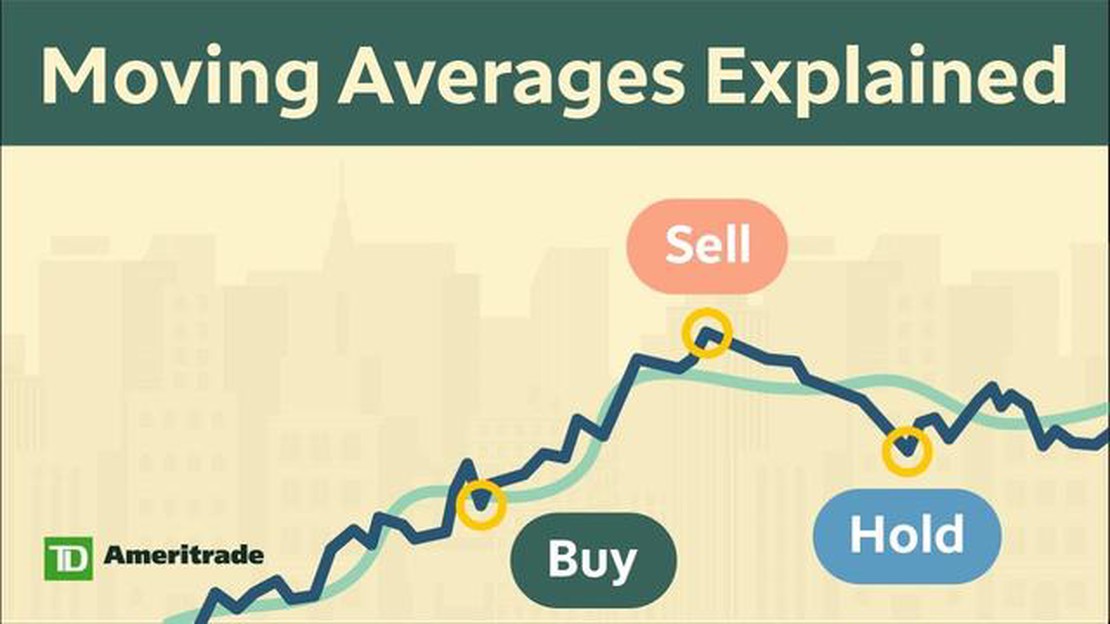
The 50-day moving average is often used in conjunction with other technical indicators to confirm trends or spot potential buy or sell signals. For example, if the price of a stock crosses above its 50-day moving average, it is considered a bullish signal, indicating a potential uptrend. On the other hand, if the price crosses below the 50-day moving average, it is seen as a bearish signal, suggesting a potential downtrend.
Traders and investors also use the 50-day moving average to identify potential support and resistance levels. If the price approaches the 50-day moving average from below and bounces off it, it can act as a support level. Conversely, if the price approaches the 50-day moving average from above and struggles to break through it, it can act as a resistance level.
Overall, the 50-day moving average is a widely used indicator that helps traders and investors gauge the overall market trend and make informed decisions about buying or selling stocks. By analyzing the relationship between the stock’s price and its 50-day moving average, market participants can gain valuable insights into potential market movements.
The 50-day moving average is a commonly used technical indicator in stock market analysis. It is a trend-following indicator that helps traders and analysts identify the overall direction of a stock’s price movement over a specific period of time.

The 50-day moving average is calculated by adding up the closing prices of a stock for the past 50 trading days and then dividing the sum by 50. This calculation is updated each trading day to reflect the most recent closing price and remove the oldest closing price from the sum.
Read Also: How many accounts can you connect to a trade copier?
For example, if a stock has closing prices of $10, $11, $12, $13, and $14 over the past five trading days, the 50-day moving average would be calculated as follows:
So, the 50-day moving average for this stock would be $12. This average is then plotted on a stock chart to visually represent the trend of the stock’s price movement over the past 50 trading days.
The significance of the 50-day moving average lies in its ability to filter out short-term fluctuations in a stock’s price and provide a smoother representation of its overall trend. Traders and analysts often use the 50-day moving average as a reference point to determine whether a stock is in an uptrend or a downtrend.
When a stock’s price is consistently above its 50-day moving average, it is considered to be in an uptrend, indicating that the stock’s price is generally rising over time. Conversely, when a stock’s price is consistently below its 50-day moving average, it is considered to be in a downtrend, indicating that the stock’s price is generally falling over time.
By understanding the definition and calculation of the 50-day moving average, traders and analysts can gain valuable insights into the overall trend of a stock’s price movement and make informed investment decisions based on this information.
The 50-day moving average is a commonly used technical indicator in stock market analysis. It is the average closing price of a stock over the past 50 trading days, which gives traders and investors an idea of the stock’s short-term trend.
One of the reasons why the 50-day moving average is significant is because it helps smooth out the daily price fluctuations and provides a more accurate representation of the overall trend. By looking at the 50-day moving average, traders can identify whether the stock is in an uptrend or a downtrend.
When the stock price is consistently trading above its 50-day moving average, it indicates that the stock is in an uptrend. This is a bullish signal and suggests that the stock’s price is likely to continue rising in the near term. Traders may use this information to make buy decisions or hold their existing positions.
Read Also: How to Activate International Transactions on ICICI Forex Card?
Conversely, when the stock price is consistently trading below its 50-day moving average, it indicates that the stock is in a downtrend. This is a bearish signal and suggests that the stock’s price is likely to continue falling in the near term. Traders may use this information to make sell decisions or avoid buying the stock.

Another significance of the 50-day moving average is its use as a support or resistance level. When the stock price approaches its 50-day moving average from below, it often acts as a support level, preventing the stock from falling further. Similarly, when the stock price approaches its 50-day moving average from above, it often acts as a resistance level, preventing the stock from rising further.
Overall, the 50-day moving average is a useful tool for traders and investors to analyze stock market trends and make informed decisions. It helps identify the short-term trend of a stock, provides buy and sell signals, and acts as a support or resistance level. By incorporating the 50-day moving average into their analysis, traders can improve their chances of success in the stock market.
The 50-day moving average is a technical analysis tool used to smooth out price fluctuations and identify trends in the stock market. It represents an average of the closing prices of a stock over the past 50 trading days.
The 50-day moving average is calculated by adding up the closing prices of a stock over the past 50 trading days and then dividing the sum by 50.
The 50-day moving average is significant because it helps investors and traders identify potential support and resistance levels. It can also indicate the overall trend of a stock, with prices above the moving average indicating a bullish trend and prices below indicating a bearish trend.
The 50-day moving average can be used to make trading decisions by acting as a buy or sell signal. For example, if the stock’s price crosses above the 50-day moving average, it could be a signal to buy, and if it crosses below, it could be a signal to sell.
Yes, there are limitations to using the 50-day moving average. It is a lagging indicator, meaning it relies on past price data and may not accurately reflect current market conditions. It can also be sensitive to short-term price fluctuations, leading to false signals.
The purpose of using a 50-day moving average in stock market analysis is to help traders and investors identify the overall trend of a stock or index. It smooths out short-term price fluctuations and provides a clearer picture of the stock’s long-term direction.
The 50-day moving average is calculated by taking the sum of the closing prices of a stock over the past 50 trading days and dividing it by 50. This calculation is repeated for each trading day to create a moving average line on a stock chart.

Is Ma 1 stationary? Stationarity is a fundamental concept in time series analysis. It refers to the statistical properties of a process remaining …
Read Article
Discover the Benefits of Option Trading Option trading is a popular investment strategy that offers several advantages for investors looking to …
Read Article
Understanding Section 1256 Reporting: Everything You Need to Know Section 1256 reporting is a crucial aspect of tax compliance for individuals and …
Read Article
Can implied volatility exceed 100%? Volatility is an important metric in the world of finance. It measures the degree of variation of a financial …
Read Article
Understanding the Significance of the 20-Day Moving Average When it comes to trading, one of the most important tools for technical analysis is the …
Read Article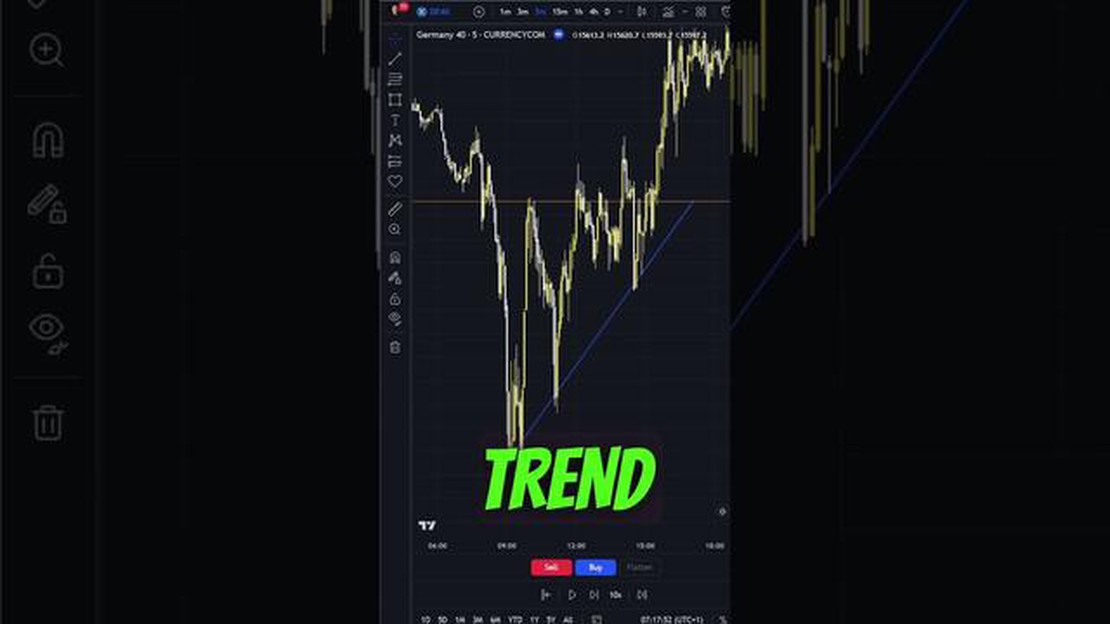
Choosing the Optimal Time Frame for Drawing Trendlines Trendlines are one of the most important tools in technical analysis, allowing traders to …
Read Article


