


CIMB Bank Malaysia: Current Interest Rates and Exchange Rates
Exchange Rates of CIMB Bank in Malaysia When it comes to banking in Malaysia, CIMB Bank is one of the leading financial institutions. Known for its …
Read Article
Tick charts have been gaining popularity among professional traders in recent years. These charts provide a unique perspective on market activity and can be a valuable tool for making trading decisions. While traditional time-based charts, such as 1-minute or 5-minute charts, show price movements over a fixed period of time, tick charts focus on the number of trades executed.
Tick charts are based on market activity, rather than time. This means that each new bar on a tick chart is created after a specified number of trades have occurred, rather than after a fixed period of time. As a result, tick charts can provide more accurate and precise information about market volatility and momentum.
Tick charts offer several advantages over time-based charts. Firstly, they can eliminate the noise and confusion that can be caused by sudden spikes or drops in the market. Since each new bar on a tick chart represents a specific number of trades, the chart can smooth out market fluctuations and provide a clearer picture of price action. Additionally, tick charts can be particularly useful for day traders who need to make quick decisions based on short-term market movements.
However, tick charts are not without their limitations. The main disadvantage is that tick charts may not be suitable for all trading strategies or timeframes. In some cases, time-based charts may still be the preferred option. Additionally, tick charts require a high level of market activity in order to be effective. Low-volume markets may not generate enough ticks to create meaningful charts.
In conclusion, tick charts can be a powerful tool for professional traders. Their ability to reveal market activity in a unique way can provide valuable insights and enhance trading decisions. However, it is important for traders to consider their trading strategy and the market conditions before deciding to use tick charts as their primary charting method.
Tick charts are a type of chart that can be used in financial trading to analyze and track price movements. Unlike time-based charts, tick charts are based on the number of trades or transactions that take place.
The term “tick” refers to a unit of measurement used in trading that represents a price change. Each time a trade occurs, the price moves up or down by one tick. Tick charts display a new bar or candlestick whenever a certain number of ticks have occurred, such as 100 or 200 ticks.

Tick charts are particularly popular among professional traders because they provide a more detailed view of market activity compared to time-based charts. Since tick charts are based on the number of trades, they can reveal trends, patterns, and market sentiment more accurately and quickly.
Tick charts can be useful in various trading strategies, such as scalping or day trading, where traders need to make quick decisions based on small price fluctuations. By using tick charts, traders can identify and capitalize on short-term price movements and intraday trends.
Read Also: Should I Buy Options on Friday? Everything You Need to Know
When using tick charts, traders can also adjust the tick count to match the volatility of the market. During periods of high volatility, traders may want to use smaller tick counts to capture more detailed price movements. In contrast, during periods of low volatility, larger tick counts can help smooth out the chart and filter out noise.
Overall, tick charts offer a valuable tool for professional traders to analyze and interpret market activity. By focusing on the number of trades rather than time, tick charts provide a unique perspective on price movements and can be used to enhance trading strategies and decision-making processes.
A tick chart is a type of chart used in trading that measures and displays market activity based on the number of trades that occur. Unlike traditional time-based charts, tick charts represent the price action in terms of the number of trades rather than the time elapsed. This makes tick charts a valuable tool for traders who want to analyze market volatility and price movements with greater precision and accuracy.
When using tick charts, each new price movement, regardless of its size, is represented by a new tick on the chart. This allows traders to see the market’s micro-structure and observe price fluctuations in real-time. Tick charts can be especially useful in fast-moving markets where time-based charts may not provide the same level of detail and accuracy.
One of the key advantages of tick charts is that they can help traders identify and analyze market trends and patterns more effectively. By focusing on the number of trades and the volume associated with each tick, traders can get a clearer picture of market sentiment and understand whether there is buying or selling pressure in the market. This information can be particularly helpful in identifying potential entry and exit points for trades.
Tick charts are also useful for managing risk and determining the right time to enter or exit a trade. Traders can use tick charts to monitor the speed and intensity of price movements, which can help them gauge market liquidity and determine the optimal size of their positions. Additionally, tick charts can provide insights into the effectiveness of their trading strategies and help them make adjustments as needed.
It is important to note that tick charts are not a one-size-fits-all solution for every trader or every market. The appropriate tick chart timeframe may vary depending on the trading style, market conditions, and specific trading goals. Some traders may prefer shorter tick chart intervals for faster analysis, while others may opt for longer tick chart intervals for a broader view of market trends.
In conclusion, tick charts offer a unique perspective on market activity and can be a valuable tool for professional traders. By focusing on the number of trades rather than the time elapsed, tick charts provide a detailed and real-time view of price action. Traders can use tick charts to identify trends, manage risk, and make informed trading decisions based on accurate and timely information.
Read Also: Is Delta Investment Tracker Free? Everything You Need to Know
Tick charts are a type of chart used in financial markets to display the price action of an asset based on the number of trades that occur, rather than on the passage of time.
Professional traders use tick charts because they provide a more accurate representation of market activity and allow for better analysis of price trends and patterns. They provide a clearer picture of market sentiment and can help traders make more informed trading decisions.

It depends on the trading strategy and personal preference of the trader. Tick charts are particularly useful for short-term traders who rely on precise entry and exit points. They can provide more detailed information about price movements during volatile periods. However, time-based charts may still be preferred by some traders who focus on longer-term trends.
Traders can use tick charts to identify trends by looking for patterns of higher highs and higher lows for an uptrend, or lower highs and lower lows for a downtrend. By analyzing the volume of trades during these trend movements, traders can gain insights into the strength of the trend and potential reversal points.
One disadvantage of using tick charts is that they can be more prone to market noise and false signals compared to time-based charts. Since tick charts are based on trade volume, they may not accurately represent the overall market sentiment or provide a complete picture of price action over longer time frames.
Tick charts are a type of chart that displays price movement based on the number of trades executed, rather than on the passage of time. Each bar on the chart represents a certain number of trades, allowing traders to see market activity more clearly.
Professional traders prefer tick charts because they provide a more detailed view of market activity and allow for better analysis of price action. Tick charts help to filter out market noise and reveal key trading patterns that are not easily visible on other types of charts.

Exchange Rates of CIMB Bank in Malaysia When it comes to banking in Malaysia, CIMB Bank is one of the leading financial institutions. Known for its …
Read Article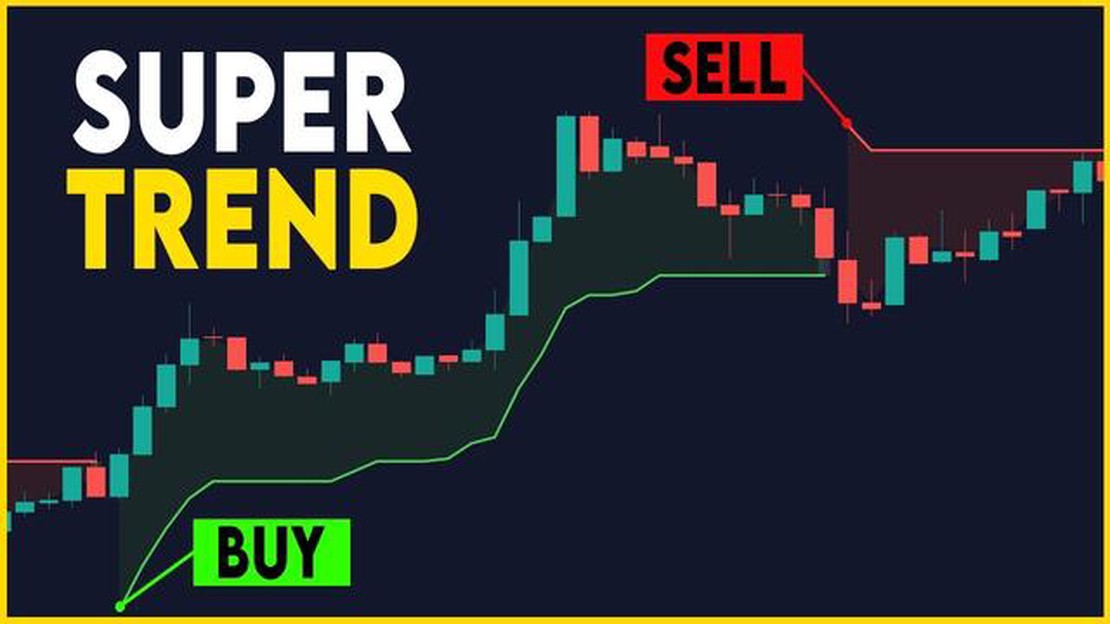
Methods for Determining Market Direction Understanding market direction is essential for successful investing and trading. Whether you are a seasoned …
Read Article
Is forex trading halal? Finding answers based on Islamic principles Forex trading, also known as foreign exchange trading, is a global decentralized …
Read Article
How to Identify a Buy Signal for RSI The Relative Strength Index (RSI) is a popular technical indicator used by traders to identify overbought and …
Read Article
How to Get a Discount Code Everyone loves a good deal, especially when it comes to online shopping. Discount codes can help you save money and get …
Read Article
Formula for Quanto Options If you’re interested in the world of finance and investments, you may have come across the term “quanto options.” These …
Read Article


