

Understanding the Importance and Application of 200 Day Moving Average Analysis
Understanding 200 day moving average analysis Technical analysis is a popular method used by traders and investors to make informed decisions in the …
Read Article
When it comes to analyzing data, the moving average is a powerful tool that can provide valuable insights. One type of moving average that is commonly used is the 4 week moving average. In this guide, we will break down the concept of the 4 week moving average and explain how to calculate and interpret it.
The 4 week moving average, also known as the 4 week average or 4-week rolling average, is a statistical technique that is used to analyze trends over a specific period of time. It is commonly used in finance, economics, and other fields to smooth out fluctuations in data and identify long-term patterns.
To calculate the 4 week moving average, you take the average of a set of data points over a 4 week period. For example, if you are analyzing weekly sales data, you would take the average of the sales for each week over a 4 week period. This allows you to observe the average sales trend over time, rather than focusing on individual data points.

The 4 week moving average is particularly useful for identifying trends and smoothing out noise in the data. It can help you identify long-term patterns, such as seasonal fluctuations or gradual changes in a variable over time. By calculating the average over a specific time period, you can filter out short-term fluctuations and focus on the overall trend.
Understanding and interpreting the 4 week moving average is essential for anyone involved in data analysis. By using this powerful tool, you can gain insights into long-term trends and make more informed decisions based on the data. Whether you are analyzing sales data, stock prices, or any other type of data, the 4 week moving average can provide valuable insights. So, if you’re a beginner in data analysis, don’t overlook the power of the 4 week moving average!
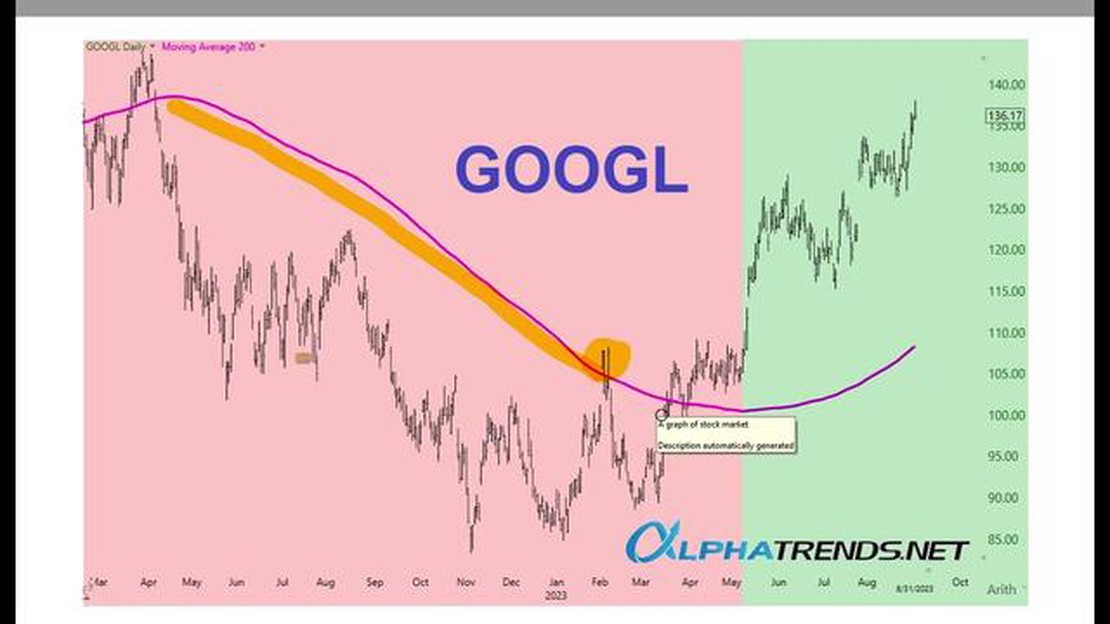
A moving average is a popular technical analysis tool used to identify trends in financial markets. It calculates the average price of a security or an index over a specific period of time, typically a fixed number of days or weeks. The moving average helps smooth out short-term price fluctuations and reveals the underlying trend of the market.
The most commonly used moving averages are the simple moving average (SMA) and the exponential moving average (EMA). The SMA is calculated by adding up the closing prices over a certain period of time and dividing the sum by the number of periods. The EMA, on the other hand, gives more weight to recent prices, making it more responsive to changes in the market. Both types of moving averages have their own advantages and disadvantages, and traders often choose the one that best suits their trading strategy.
Read Also: Learn about the straddle and strangle combination strategy
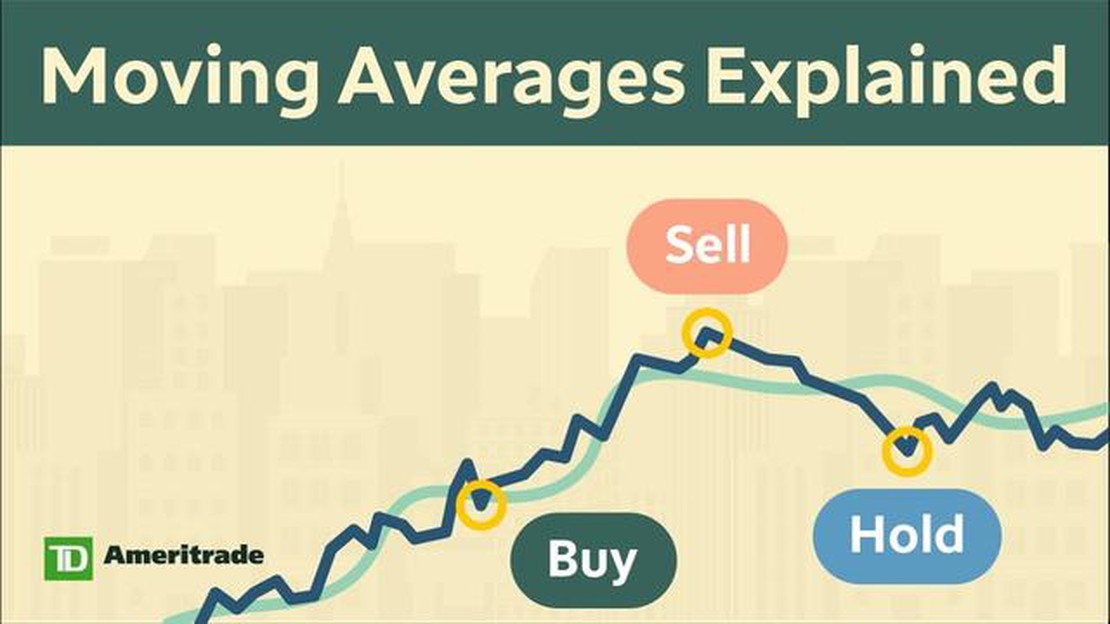
Traders use moving averages in various ways. One common approach is to use a moving average crossover strategy, which involves plotting two moving averages on a price chart and looking for a crossover, where the shorter-term moving average crosses above or below the longer-term moving average. A bullish crossover (shorter-term MA crossing above longer-term MA) is considered a buy signal, while a bearish crossover (shorter-term MA crossing below longer-term MA) is considered a sell signal.
Another way to use moving averages is to identify support and resistance levels. When the price of a security or an index approaches a moving average from below and bounces off it, the moving average can act as a support level. Similarly, when the price approaches a moving average from above and fails to break through it, the moving average can act as a resistance level.
Moving averages can also be used to set stop-loss orders and take-profit levels. Traders often place their stop-loss orders below a moving average to limit their potential losses, while setting their take-profit levels above a moving average to lock in their profits.
Overall, moving averages are a versatile tool that can be used by both short-term traders and long-term investors. They provide valuable insights into market trends and help traders make informed decisions based on historical price data.
When it comes to analyzing data and trends in the financial markets, using the right tools is crucial. One such tool that is widely used by analysts and traders is the 4 week moving average.
The 4 week moving average is a simple yet powerful tool that helps smooth out the fluctuations in data over a period of 4 weeks. It is calculated by taking the average of a set of data points over a 4 week period.
Read Also: OctaFX iPhone App: Trade Forex Anytime, Anywhere
So why is using a 4 week moving average important? Here are a few reasons:
In conclusion, the 4 week moving average is an important tool for analyzing data and trends in the financial markets. It helps reduce noise, identify support and resistance levels, confirm trends, and smooth out seasonal effects. By using this tool, traders and investors can make more informed decisions and improve their chances of success in the markets.
A 4 week moving average, also known as a 4-week simple moving average, is a calculation that helps to smooth out the fluctuations in data over a 4-week period. It is commonly used to analyze trends and patterns in various financial and economic indicators.
To calculate a 4 week moving average, you add up the values of the data points from the past 4 weeks and then divide the sum by 4. This gives you the average value for that particular 4-week period. As new data becomes available, the oldest value is dropped, and the newest value is added, recalculating the average.

A 4 week moving average is important because it helps to smooth out short-term fluctuations in data, making it easier to identify underlying trends. It is particularly useful when analyzing data with seasonal patterns or when trying to determine the direction of a market or economic indicator.
Yes, a moving average can be calculated for any time period. The choice of time period depends on the specific analysis being conducted and the data being used. For shorter-term analysis, a 4 week moving average may be appropriate, while for longer-term trends, a 12-month moving average or longer might be more suitable.

Understanding 200 day moving average analysis Technical analysis is a popular method used by traders and investors to make informed decisions in the …
Read Article
Understanding ETS: Exploring Its Functionality and Operation Emission Trading Systems (ETS) have become a key tool in the global effort to combat …
Read Article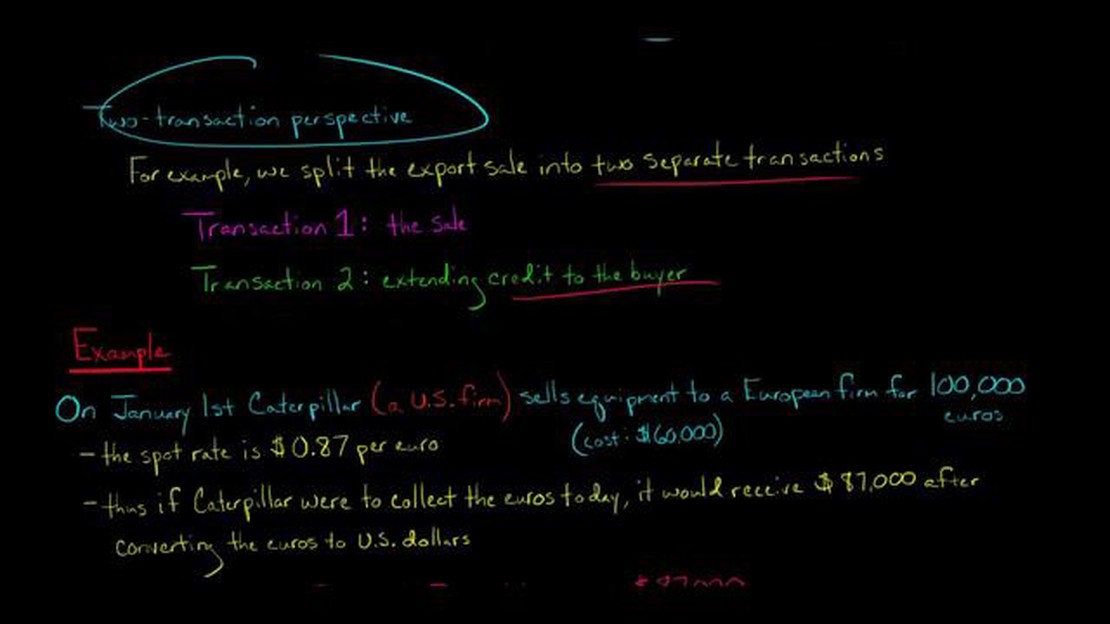
Where to report foreign exchange gain or loss on income statement? Foreign exchange gains or losses can have a significant impact on a company’s …
Read Article
When does the gold market open? Gold has always been a popular investment option due to its inherent value and stability. Whether you are a seasoned …
Read Article
Hours of F& F& is a popular establishment that offers a wide range of services and products. From delicious meals to high-quality goods, F& has …
Read Article
Understanding the Moving Average in Management In the fast-paced world of business and management, companies are constantly seeking ways to stay ahead …
Read Article


