


Get the Best Bonus on OctaFX Deposits - Limited Time Offer | OctaFX
OctaFX Deposit Bonus: Is it Available? OctaFX is offering a limited time bonus on deposits that you don’t want to miss. Whether you are a new or …
Read Article
When it comes to technical analysis in the financial markets, Bollinger Bands are a popular tool used by traders to identify potential breakouts. Developed by John Bollinger in the 1980s, Bollinger Bands are a type of statistical chart that is plotted above and below a simple moving average. These bands dynamically adjust to market conditions, expanding when volatility increases and contracting when volatility decreases.
The concept of Bollinger Band breakouts revolves around the idea that periods of low volatility are often followed by periods of high volatility. Traders look for breakouts above or below the bands as a sign that a significant price move may be on the horizon. When the price breaches the upper band, it is viewed as a bullish signal, indicating that the market is overbought. Conversely, when the price breaches the lower band, it is seen as a bearish signal, suggesting that the market is oversold.
However, it’s important to note that Bollinger Bands should not be used in isolation. Traders often combine this tool with other technical indicators and chart patterns to increase the probability of successful trades. Additionally, it’s crucial to consider other factors such as market trends, volume, and news events when interpreting Bollinger Band breakouts.
In conclusion, understanding Bollinger Band breakouts is an essential skill for traders looking to capitalize on potential price movements in the financial markets. By identifying periods of low volatility and spotting breakouts above or below the bands, traders can potentially enter trades with favorable risk-to-reward ratios. However, it is crucial to use Bollinger Bands in conjunction with other tools and factors to make informed trading decisions.
Bollinger Bands are a technical analysis tool that consists of a middle band, typically a 20-day simple moving average (SMA), and two outer bands. The outer bands are standard deviations of the middle band. The standard deviation is a statistical measure that quantifies the volatility or dispersion of a dataset.
The purpose of Bollinger Bands is to provide a relative definition of high and low prices. When the price is approaching the upper band, it is considered overbought, and when the price is approaching the lower band, it is considered oversold. Traders often use Bollinger Bands to identify periods of low volatility, which may precede significant price moves.
The width of the Bollinger Bands represents the volatility of the market. When the bands are narrow, it indicates low volatility, while widening bands indicate higher volatility. Traders can use this information to assess the potential profit or risk of a trade.
Bollinger Bands can also help identify potential trend reversals. A breakout occurs when the price breaks above the upper band or below the lower band. Breakouts can indicate a continuation of the trend or a reversal, depending on other technical indicators and market conditions.

It is important to note that Bollinger Bands are not a standalone indicator and should be used in conjunction with other technical analysis tools to make informed trading decisions.
Bollinger Bands are a technical analysis tool that was created by John Bollinger in the 1980s. They consist of a set of lines plotted two standard deviations above and below a simple moving average of a security’s price. The purpose of Bollinger Bands is to provide a relative definition of high and low price levels of a security. By encompassing the majority of a security’s price movement, Bollinger Bands help identify potential breakouts.
The upper and lower bands of the Bollinger Bands represent volatility-based trading signals. When the price reaches the upper band, it is considered overbought, suggesting a potential reversal or decrease in price. On the other hand, when the price reaches the lower band, it is considered oversold, indicating a potential reversal or increase in price.
The width of the Bollinger Bands can also be used to gauge volatility. When the bands are wide, it suggests high market volatility, while narrow bands indicate low volatility. Traders can utilize this information to make informed decisions about entering or exiting trades.
Read Also: Discover the Top 5 Financial Derivatives You Need to Know
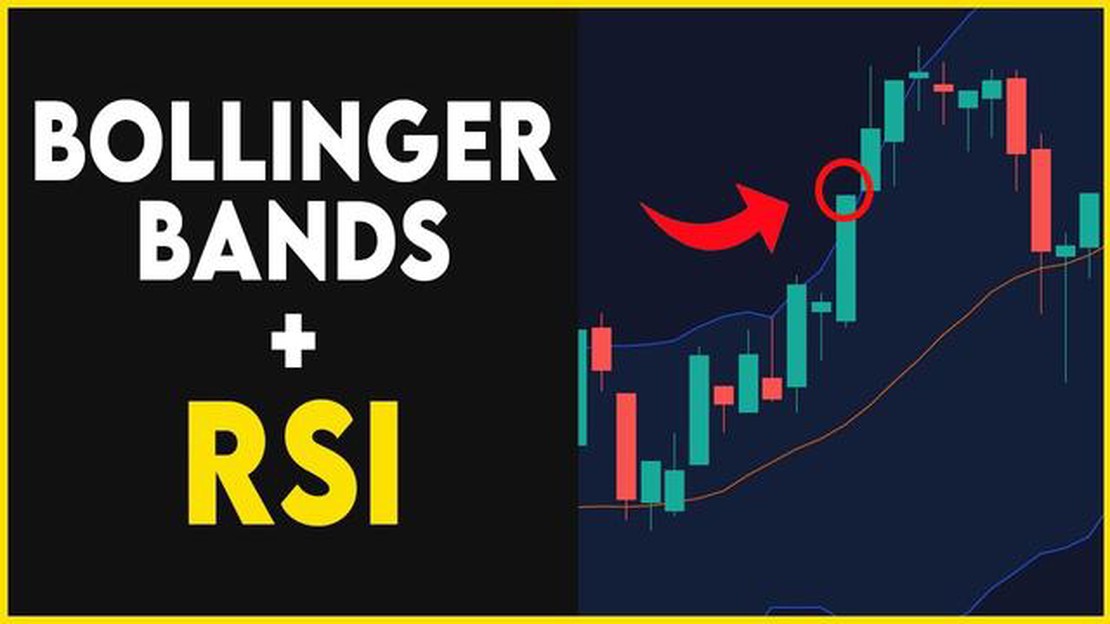
In addition, Bollinger Bands can be used in conjunction with other technical indicators to confirm signals and improve trade accuracy. Some commonly used indicators include the Relative Strength Index (RSI) and the Moving Average Convergence Divergence (MACD).
| Upper Band | The upper band is calculated by adding two standard deviations to the moving average. |
| Moving Average | The moving average is calculated as the average price over a specified time period. |
| Lower Band | The lower band is calculated by subtracting two standard deviations from the moving average. |
Bollinger Bands are a technical analysis tool created by John Bollinger in the 1980s. They are used to measure market volatility and identify potential trend reversals. Bollinger Bands consist of three lines:
These three lines create a channel around the price chart, which helps traders visualize the volatility of the market. When the price is moving within the channel, it is considered to be within a normal range. However, when the price breaks above or below the upper or lower band, it is seen as an indication of a potential trend reversal.
Read Also: Is Trade Legal in Malaysia? | Everything You Need to Know
The width of the Bollinger Bands can provide information about the volatility of the market. When the bands are narrow, it suggests that the market is relatively calm and there is low volatility. Conversely, when the bands widen, it indicates increased volatility.
Traders can use Bollinger Bands in several ways. One common strategy is to wait for the price to break above or below the bands and then open a position in the direction of the breakout. This can be an indication that a new trend is forming. Traders can also use Bollinger Bands to identify overbought or oversold conditions, where the price has moved too far away from the average and is likely to reverse.
It is important to note that Bollinger Bands should not be used in isolation and should be used in conjunction with other technical analysis tools and indicators. They are best used as a supplement to existing trading strategies and should be combined with other forms of analysis for optimal results.
Bollinger Bands are a technical analysis tool that is used to measure the volatility of a financial instrument. They consist of three lines: the middle band, which is a simple moving average, and an upper and lower band that are two standard deviations away from the middle band.

Bollinger Bands can help identify breakouts by measuring the volatility of a financial instrument. When the price of the instrument moves outside of the upper or lower band, it may indicate a breakout. Traders can use this information to potentially enter or exit trades.
A Bollinger Band squeeze occurs when the distance between the upper and lower bands narrows. This indicates a period of low volatility and is often followed by a period of high volatility. Traders often look for a Bollinger Band squeeze as a potential precursor to a breakout.
One strategy for trading Bollinger Band breakouts is to wait for the price to move outside of the upper or lower band and then enter a trade in the direction of the breakout. Another strategy is to wait for a Bollinger Band squeeze to occur and then enter a trade in the direction of the breakout once volatility increases.
While Bollinger Bands can be a useful tool in identifying breakouts, they are not foolproof and may not be effective in all market conditions. Traders should always consider other factors, such as trend analysis and other technical indicators, when making trading decisions.
Bollinger Bands are a technical analysis tool comprised of a middle band (usually a 20-day simple moving average), an upper band, and a lower band. The upper and lower bands are based on the standard deviation of the price from the middle band. Bollinger Bands are used to identify volatility and potential trend reversals in a security or financial instrument.
When the price breaks out of the Bollinger Bands, it means that the price has moved outside of the expected range of volatility. A breakout above the upper band is considered a bullish signal, indicating potential upward momentum, while a breakout below the lower band is considered a bearish signal, indicating potential downward momentum.

OctaFX Deposit Bonus: Is it Available? OctaFX is offering a limited time bonus on deposits that you don’t want to miss. Whether you are a new or …
Read Article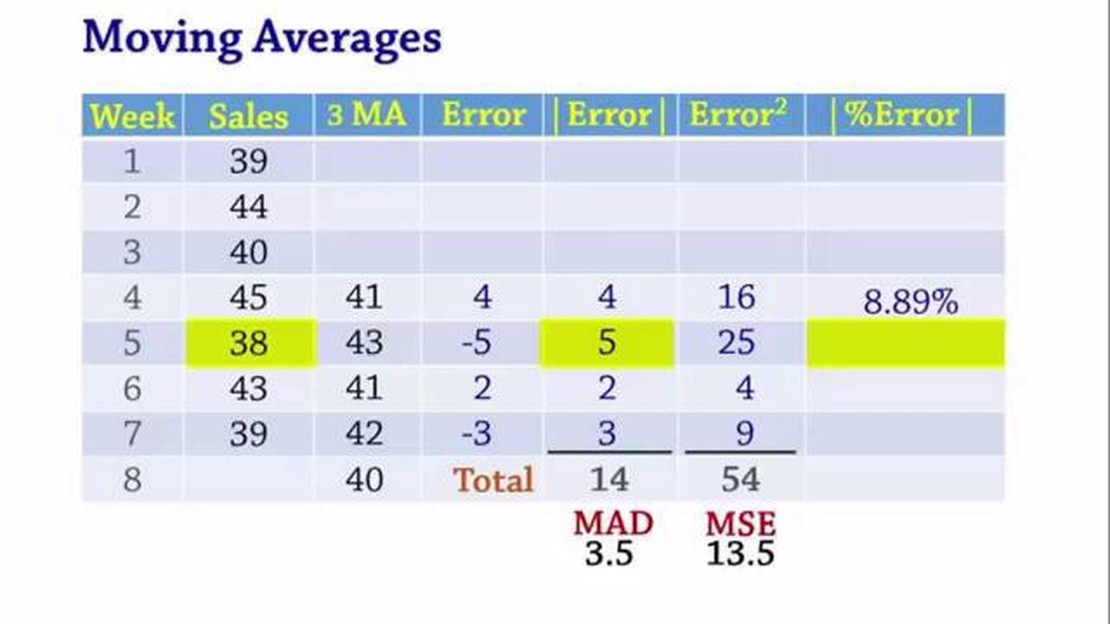
Basic Difference between Weighted Moving Average and Exponential Smoothing Quizlet In the world of data analysis and forecasting, two popular …
Read Article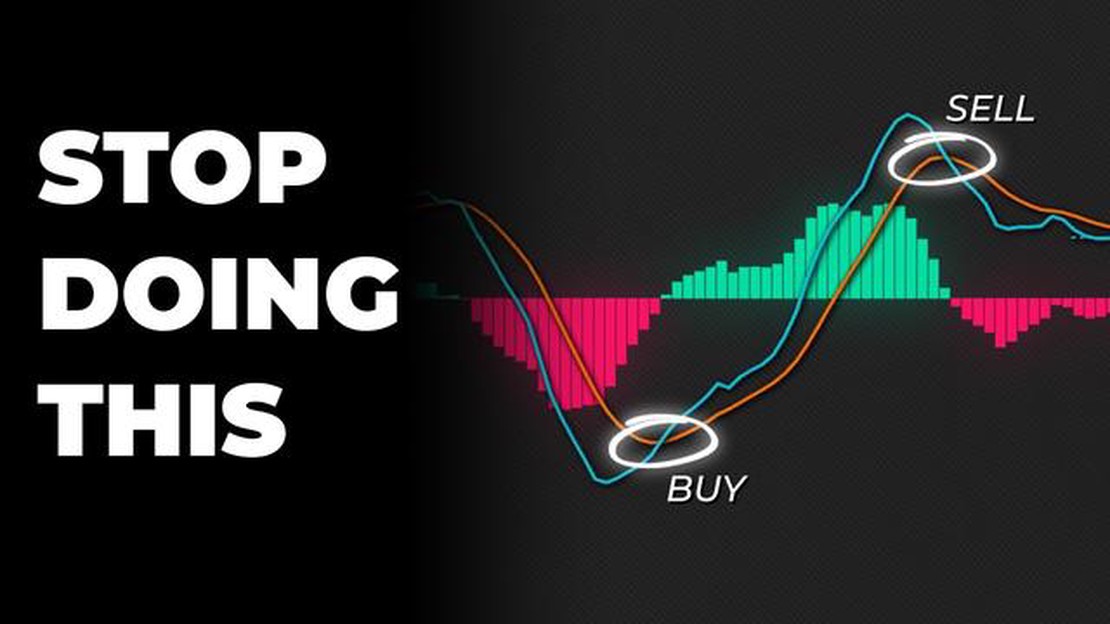
Choosing the Best MACD Signal: A Comprehensive Guide In the world of trading, finding the best signals is crucial for success. One such signal that …
Read Article
What is over that one Cannot take stock crossword? The crossword puzzle has long been a favorite pastime for millions of people around the world. With …
Read Article
What Happens to Walmart Stock When You Quit? Investing in stocks can be a smart way to grow your wealth over time. When building an investment …
Read Article
Is Fidelity Stock Screener Free? When it comes to investing, finding the right stocks to buy can be a daunting task. With thousands of options …
Read Article


