


Are there free templates available for WordPress?
Are Free Templates Available for WordPress? If you are looking to build a website or a blog using WordPress, the good news is that there are plenty of …
Read Article
In the world of trading, finding the best signals is crucial for success. One such signal that traders swear by is the Moving Average Convergence Divergence (MACD). This indicator, developed by Gerald Appel, is a powerful tool for identifying potential buying and selling opportunities in the market.
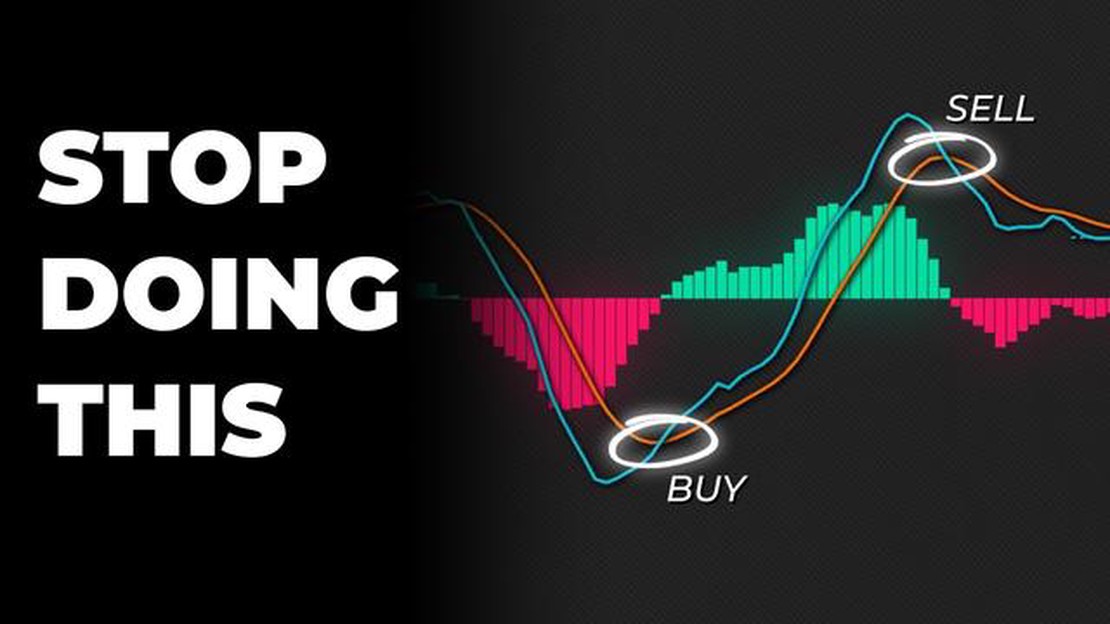
The MACD calculates the difference between two moving averages of different time periods. This difference is then plotted on a chart as a line known as the MACD line. In addition to the MACD line, a signal line is also plotted, which is a smoothed average of the MACD line. Traders use the crossing of these two lines as a signal to buy or sell.
However, not all crosses of the MACD and signal lines are reliable. To boost your trading strategy, it’s important to look for the best MACD signals. One such reliable signal is the bullish or bearish divergence. This occurs when the price of an asset is moving in the opposite direction of the MACD line, indicating a potential trend reversal. Traders often use this signal to enter or exit positions.
Another powerful signal is the zero line crossover. When the MACD line crosses above the zero line, it’s a bullish signal, suggesting that the trend is turning upward. Conversely, when the MACD line crosses below the zero line, it’s a bearish signal, indicating that the trend is turning downward. This signal can help traders to determine the direction of the market and make profitable trades.
To summarize, the MACD is a popular indicator that can greatly enhance your trading strategy. By paying attention to reliable signals such as bullish or bearish divergences and zero line crossovers, you can increase your chances of making successful trades. Remember to always analyze the market and use proper risk management techniques alongside these signals to maximize your profits and minimize losses.
When using the MACD indicator, it is important to find the optimal settings that best suit your trading strategy and the specific market you are trading in. The default settings for the MACD indicator are usually 12, 26, and 9, but these can be adjusted to better match your needs.

One approach to finding the optimal MACD settings is to experiment with different values and analyze the results. You can start by changing the values of the fast and slow moving averages (usually 12 and 26) and observing how the indicator behaves. A shorter time period for the fast moving average will result in a more sensitive indicator, while a longer time period will smooth out the signals.
Another important aspect to consider when finding the optimal MACD indicator is the market you are trading in. Different markets exhibit different behaviors, and what works well in one market may not work as effectively in another. Therefore, it is essential to conduct thorough research and analysis to determine the best settings for the specific market conditions you are trading in.
Additionally, it is important to combine the MACD indicator with other technical analysis tools to validate the signals generated. This can include using support and resistance levels, trend lines, or other indicators that complement the MACD indicator.
Overall, finding the optimal MACD indicator requires experimentation, analysis, and an understanding of the market conditions. By customizing the settings and combining it with other technical analysis tools, you can significantly boost your trading strategy and improve your chances of making profitable trades.
Read Also: Calculating Profit on Stock Options: A Step-by-Step Guide
The Moving Average Convergence Divergence (MACD) is a popular technical indicator used by traders to identify potential trends and generate trading signals. It is a versatile tool that can be applied to various markets and timeframes, making it a must-have for traders of all levels.
Understanding how MACD works and how to interpret its signals is crucial for mastering the art of trading. By learning to effectively use MACD, traders can gain valuable insights into market momentum and make more informed decisions.
MACD consists of three main components: the MACD line, the signal line, and the histogram. The MACD line plots the difference between two moving averages, usually the 12-day and 26-day exponential moving averages (EMA). The signal line is a smoothed version of the MACD line, typically a 9-day EMA. The histogram represents the difference between the MACD line and the signal line, providing visual clarity on bullish or bearish momentum.
Traders can utilize MACD in various ways. One common strategy is to look for crossovers between the MACD line and the signal line. A bullish crossover occurs when the MACD line crosses above the signal line, indicating a potential buying opportunity. Conversely, a bearish crossover happens when the MACD line falls below the signal line, suggesting a possible selling opportunity. Traders can also analyze the histogram to identify divergences, which occur when the histogram deviates from the price action, signaling a potential trend reversal.
Read Also: Discover the Advantages of AI in Forex Trading | OurPlatform
While MACD can provide valuable insights, it is important to note that it should not be used in isolation. It is recommended to use MACD in conjunction with other indicators and tools to confirm signals and reduce the risk of false positives. Additionally, traders should consider incorporating risk management strategies, such as stop-loss orders, to protect their capital.
In conclusion, mastering MACD is essential for traders looking to boost their trading strategy. By understanding how MACD works and how to interpret its signals, traders can gain a competitive edge in the market and improve their chances of success. Whether you are a novice or an experienced trader, incorporating MACD into your trading toolbox is a must.
MACD stands for Moving Average Convergence Divergence. It is a popular technical indicator used in trading to identify potential buy and sell signals. MACD works by calculating the difference between two exponential moving averages (EMA) of different lengths. Then, a signal line (EMA of MACD) is plotted to generate trading signals when it crosses above or below the MACD line.
MACD can be used as a standalone trading strategy, but it is often combined with other indicators or chart patterns for confirmation. It is important to consider other factors such as trend analysis, support and resistance levels, and volume to make more informed trading decisions. Using MACD in conjunction with other tools can increase the accuracy and reliability of your trading strategy.

The best settings for MACD can vary depending on the market and time frame you are trading. However, a common setting is using a 12-period EMA, a 26-period EMA, and a 9-period EMA for the signal line. These settings are widely used and can provide reliable signals. It is recommended to test different settings and adjust them based on your trading style and preferences.
MACD generates different types of signals, including crossovers, centerline crossovers, and divergences. Crossovers occur when the MACD line crosses above or below the signal line, indicating a potential trend reversal or continuation. Centerline crossovers happen when the MACD line crosses above or below the zero line, signaling a change in momentum. Divergences occur when the MACD line diverges from the price, suggesting a possible trend reversal.
Using MACD in your trading strategy can be beneficial by helping you identify potential entry and exit points. You can use MACD crossovers, centerline crossovers, and divergences to time your trades and confirm trends. It is important to combine MACD with other indicators or chart patterns for confirmation and to consider other factors such as market conditions and risk management. Regularly analyzing and backtesting your strategy can also help you refine it and improve your overall trading results.
MACD stands for Moving Average Convergence Divergence. It is a widely used technical indicator in trading which helps identify potential trend reversals, bullish or bearish market conditions, and generate buy and sell signals.

Are Free Templates Available for WordPress? If you are looking to build a website or a blog using WordPress, the good news is that there are plenty of …
Read Article
Exploring M1 and M2: Understanding the Differences In the world of economics and finance, M1 and M2 are two commonly used terms that refer to …
Read Article
Is Pacific Union a Legitimate Company? Pacific Union is a company that has generated a lot of buzz in the financial world. But is it legitimate? Many …
Read Article
Understanding the Difference Between Spread Betting and FX Active When it comes to trading in the financial markets, there are various methods that …
Read Article
What is the Maximum Earning Potential on Forex? Have you ever wondered how people make massive profits by trading currencies? Welcome to the world of …
Read Article
The Time Value of an Option in CFA: Understanding its Importance Options are financial instruments that give the holder the right, but not the …
Read Article


