

MLB Trade Deadline 2023: Everything You Need to Know
MLB Trade Deadline in 2023: Explained The MLB Trade Deadline is one of the most exciting times of the year for baseball fans and teams alike. It’s a …
Read Article
Day trading, a popular form of short-term investing, requires diligent analysis and decision-making in order to profit from the fluctuations in the financial markets. There are several types of analysis commonly used by day traders to identify potential trading opportunities and make informed decisions.
Fundamental analysis involves examining the financial health, performance, and news surrounding a company or market. Day traders who utilize fundamental analysis study factors such as revenue, earnings, and industry trends to determine whether a stock or market is undervalued or overvalued.
Technical analysis relies on charts, patterns, and indicators to forecast the future price movements of securities. Day traders who use technical analysis often look at historical price and volume data to identify patterns and trends, which they believe can help predict future price movements.
Sentiment analysis involves gauging market sentiment and investor psychology. Day traders who employ sentiment analysis assess various factors, such as news headlines, social media activity, and market sentiment indicators, to determine whether the overall sentiment is bullish or bearish.
Quantitative analysis relies on mathematical models and statistical techniques to analyze data and make trading decisions. Day traders who employ quantitative analysis use algorithms and computer programs to identify and execute trades based on predefined rules and criteria.
By combining these different types of analysis, day traders can gain a comprehensive understanding of the markets and make more informed trading decisions. It is important for day traders to continuously analyze and adapt their strategies as market conditions change in order to increase their chances of success.
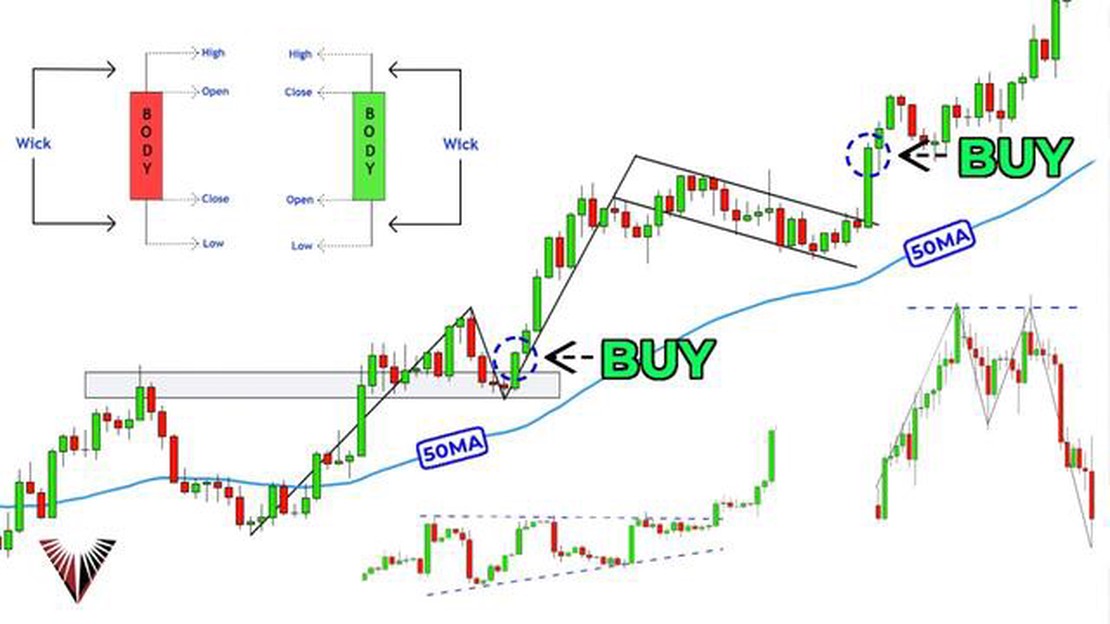
Technical analysis is a popular analysis technique used by day traders to make trading decisions. It involves analyzing historical price data and volume to predict future price movements. Understanding technical analysis can give day traders an edge in the market.

There are several key principles of technical analysis that day traders should understand:
| Trend analysis: | Day traders use trend analysis to identify the direction of the market. This involves analyzing price charts and looking for patterns and indicators that indicate whether the market is trending up, down, or sideways. |
| Support and resistance levels: | Support levels are prices at which the market has historically had difficulty falling below, while resistance levels are prices at which the market has historically had difficulty rising above. Day traders use these levels as potential entry and exit points. |
| Technical indicators: | Technical indicators are mathematical calculations based on price and volume data. They can help day traders identify trends, momentum, and potential reversal points. Some common technical indicators include moving averages, MACD, RSI, and Bollinger Bands. |
| Chart patterns: | Day traders often look for specific chart patterns, such as triangles, double tops, and head and shoulders patterns. These patterns can provide clues about potential price movements and help traders make decisions about buying or selling. |
| Volume analysis: | Volume analysis involves analyzing the trading volume of a particular asset. Day traders use volume analysis to confirm the strength of a trend or to detect potential reversals. High volume during a price move can indicate strong market participation and validate the move. |
| Risk management: | Day traders must have a solid risk management strategy in place when using technical analysis. This includes setting stop-loss orders to limit potential losses and using proper position sizing techniques to manage risk effectively. |
By understanding and applying technical analysis principles, day traders can make more informed trading decisions and increase their chances of success in the volatile day trading environment.
Fundamental analysis is a method used by day traders to evaluate the intrinsic value of a stock by examining various factors that could affect its price. It involves analyzing the financial and non-financial aspects of a company to determine its potential for growth and profitability.
Read Also: IAS 21 Summary: Understanding the International Accounting Standard for Foreign Currency
One of the key components of fundamental analysis is analyzing a company’s financial statements, including its income statement, balance sheet, and statement of cash flows. These documents provide valuable information about a company’s revenues, expenses, assets, and liabilities, which can help day traders gain insights into its financial health.
Another aspect of fundamental analysis is evaluating the overall health of the economy and industry in which the company operates. Day traders need to consider factors such as GDP growth, inflation rates, interest rates, and industry trends. This macroeconomic analysis helps them understand the broader context in which a company operates and how it may be affected by external factors.
Read Also: How Much Is 0.01 Lot? Explained | Learn Forex Trading Basics
Additionally, day traders may examine a company’s management team and corporate governance practices. The competence and integrity of a company’s management can significantly impact its performance and stock price. Traders also look at factors such as company culture, employee turnover rates, and customer satisfaction to get a holistic view of a company’s operations.
News and events also play a crucial role in fundamental analysis. Traders need to monitor news related to the company in which they are interested, as well as any major events or announcements that could impact the stock price. This could include product launches, mergers and acquisitions, regulatory changes, and earnings reports.
While fundamental analysis provides valuable insights, it is important to note that day traders also use other types of analysis, such as technical analysis, to make informed trading decisions. By combining different types of analysis, traders can develop a more comprehensive understanding of a stock’s potential and reduce the risk of making erroneous trading decisions.
Fundamental analysis is a powerful tool for day traders, as it helps them identify potential opportunities and make informed trading decisions. However, it is important to conduct thorough research and analysis to ensure accurate and reliable results. Day traders should also stay updated with the latest news and market trends to adapt their strategies as needed.

There are several types of analysis used by day traders, including technical analysis, fundamental analysis, and sentiment analysis.
Technical analysis is a method of analyzing securities based on statistical trends and patterns in historical trading data.
Fundamental analysis involves evaluating the financial health and performance of a company to determine its potential for growth or decline.
Sentiment analysis is the process of gauging the overall sentiment or mood of the market or a particular security by analyzing social media posts, news articles, and other sources of public opinion.
Day traders may use one or a combination of different types of analysis, depending on their trading strategies and preferences.
The main types of analysis used by day traders are technical analysis, fundamental analysis, and market sentiment analysis.

MLB Trade Deadline in 2023: Explained The MLB Trade Deadline is one of the most exciting times of the year for baseball fans and teams alike. It’s a …
Read Article
Can anyone succeed in options trading? Options trading is a type of investment that involves buying and selling options contracts on various …
Read Article
How to Find My IBAN Number? Have you ever needed to find your IBAN number, but didn’t know where to start? Don’t worry, we’ve got you covered! In this …
Read Article
Understanding the Sell Stop Function in Forex Trading In the world of forex trading, it is crucial to have a thorough understanding of the various …
Read Article
Best computer specs for day trading Day trading requires a robust computer setup that can handle the demands of analyzing real-time market data and …
Read Article
Which magic key is the highest? Unlocking doors to unimaginable knowledge and boundless opportunities, the Most Powerful Magic Key in the World holds …
Read Article


