

The Ultimate Guide to Commodity Trading Strategies: What Works Best for You?
What is the Best Strategy for Commodity Trading? Commodity trading is an integral part of the global financial market, offering opportunities for …
Read Article
Trading in the financial markets can be both exciting and challenging, especially for beginners. To succeed in this highly competitive field, it is essential to have a deep understanding of technical indicators and how to interpret them. Technical indicators are powerful tools that can help traders analyze market trends, identify potential entry and exit points, and make informed trading decisions.
However, learning technical indicators can seem overwhelming at first. With so many different indicators to choose from and complex mathematical formulas to understand, it’s easy to get lost in the sea of information. This beginner’s guide aims to simplify the learning process and provide you with the essential knowledge and skills to effectively use technical indicators in your trading strategy.
Firstly, it’s important to understand that technical indicators are mathematical calculations based on historical price and volume data. They provide traders with visual representations of market trends and patterns, allowing them to spot potential trading opportunities. By analyzing these indicators, traders can gain valuable insights into the market’s direction and make predictions about future price movements.
“Technical indicators are like a compass for traders navigating the financial markets. They provide valuable insights and guide traders towards profitable trades.”
One key aspect of learning technical indicators is understanding the different types of indicators available. There are various categories of indicators, including trend-following indicators, momentum indicators, volatility indicators, and volume indicators. Each type serves a specific purpose and can provide unique insights into the market.
Moreover, it’s crucial to learn how to interpret and use these indicators effectively. Analyzing technical indicators involves understanding the signals they generate, such as buy or sell signals, as well as understanding how to interpret overbought and oversold levels. Additionally, it’s important to consider other factors, such as market conditions and news events, when using technical indicators.

By learning technical indicators and improving your trading skills, you can increase your chances of success in the financial markets. These indicators can help you make more informed trading decisions, manage risk effectively, and identify profitable trading opportunities. So, whether you are a beginner or an experienced trader, investing time and effort into learning technical indicators is a worthwhile endeavor.
Technical analysis is a method used by traders and investors to study historical market data and make predictions about future price movements. It is based on the belief that past price data can help predict future price movements. Technical analysts use various tools and techniques, such as charts, patterns, and indicators, to identify trends and patterns in the market.
One of the key concepts in technical analysis is the idea that market prices reflect all available information. This means that all relevant factors, such as economic data, news events, and market sentiment, are already reflected in the price of an asset. Technical analysts believe that by analyzing price data and historical patterns, they can gain insight into the future direction of prices and make profitable trades.
Read Also: The Key Differences: Future Trading vs. Option Trading Explained
There are three main assumptions of technical analysis:
Technical analysis is widely used in many financial markets, including stocks, commodities, and forex. It can be used by both short-term traders and long-term investors to make trading decisions. However, it is important to note that technical analysis is not foolproof and does not guarantee successful trading. It is just one tool among many that traders use to analyze markets and make informed decisions.
By understanding the basics of technical analysis and learning how to use various indicators and tools, traders can improve their trading skills and increase their chances of making profitable trades.
Technical indicators are mathematical calculations based on historical price data, volume, or other market data. They provide traders with insights into the market trends, momentum, and potential reversals. Here are some commonly used technical indicators:
Read Also: Understanding Forex Trading Styles: A Guide for Beginners
It is important to note that technical indicators should not be used in isolation but in conjunction with other analysis techniques. Traders should also consider other factors, such as market fundamentals and risk management, when making trading decisions.
Technical indicators are tools used in trading to analyze past and present market data, with the aim of predicting future price movements.
Technical indicators provide traders with valuable insights into market trends and potential price movements. They help identify entry and exit points for trades, and can be used to confirm or contradict other trading signals.

As a beginner, it is important to start with the basics. Begin by understanding the different types of technical indicators and their purpose. Then, familiarize yourself with the common indicators used by traders and learn how to interpret their signals. Practice using indicators on historical price data and analyze their performance. It is also helpful to read books and take online courses on technical analysis.
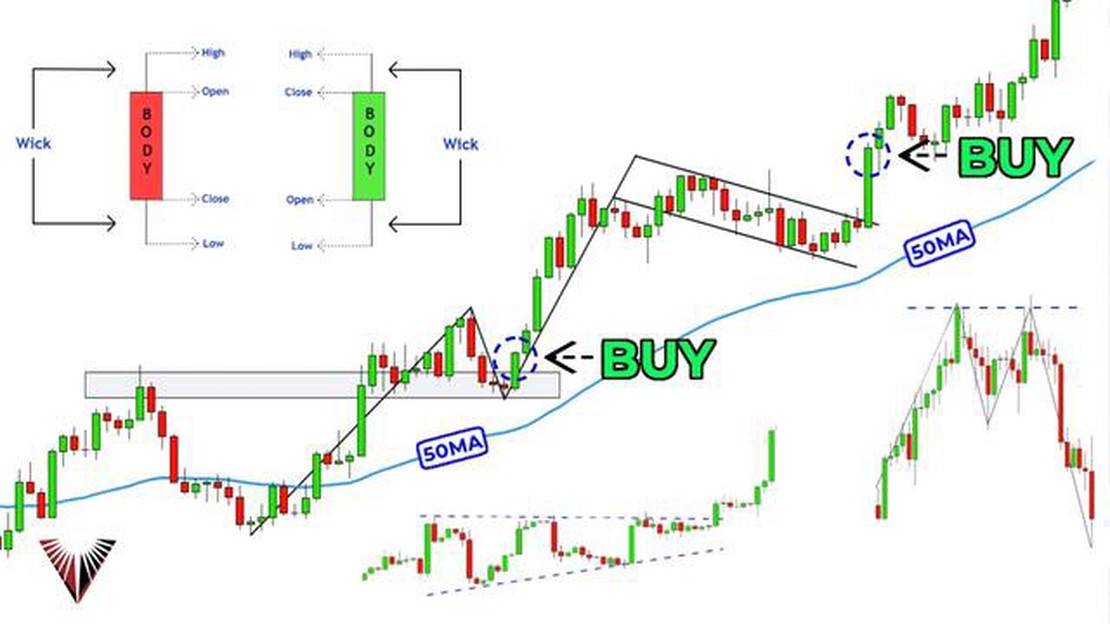
Some common technical indicators include moving averages, relative strength index (RSI), stochastic oscillator, MACD (Moving Average Convergent Divergent), Bollinger Bands, and Fibonacci retracement.
The time it takes to become proficient in using technical indicators varies from person to person. It depends on the individual’s dedication to learning and practicing, their prior knowledge of trading and technical analysis, and their ability to understand and apply the concepts. With consistent effort and practice, a beginner trader can start gaining proficiency in a few months to a year.
Technical indicators are mathematical calculations based on historical price and volume data that traders use to analyze market trends and predict future price movements.

What is the Best Strategy for Commodity Trading? Commodity trading is an integral part of the global financial market, offering opportunities for …
Read Article
Understanding the Movement of Forex Markets Forex, or the foreign exchange market, is the largest and most liquid financial market in the world. It …
Read Article
Is paper trading a good broker? Paper Trading is a well-known broker that offers a wide range of services for investors. With its extensive experience …
Read Article
Is binary options trading legal in India? Binary options trading is a popular investment option in many countries around the world. However, in India, …
Read Article
Which currency converter is the best? When traveling abroad or dealing with international transactions, having a reliable currency converter is …
Read Article
Will USD Grow Stronger? The US dollar (USD) is one of the most important and widely used currencies in the world. It plays a crucial role in global …
Read Article


