


Understanding the Meaning of Clearing in Trading - All You Need to Know
The Meaning of Clearing in Trading Clearing is an essential process in the financial markets that ensures the smooth and efficient settlement of …
Read Article
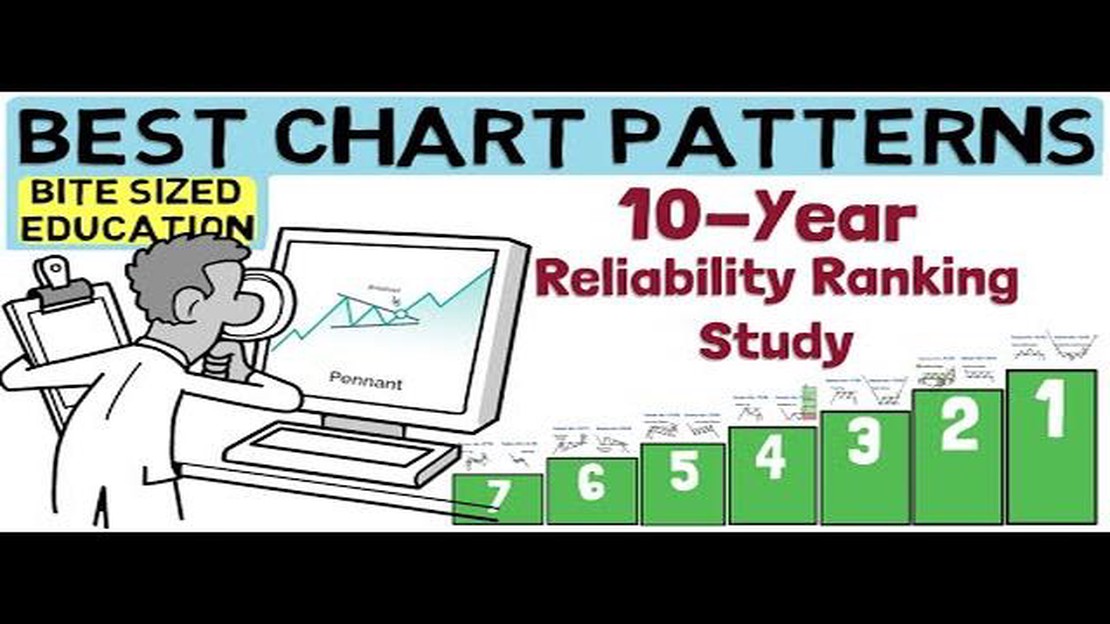
When it comes to trading in the Forex market, chart patterns play a crucial role in predicting future price movements. Amongst the various chart patterns that traders use, there is one pattern that stands out for its accuracy and reliability. In this article, we will delve into the details of this pattern, uncovering the best techniques to identify and trade it successfully.
The pattern we are referring to is the Double Top pattern. This pattern occurs when the price of an asset reaches a high point (forming the first peak), followed by a retracement, and then reaches another high point (forming the second peak) that is at a similar level as the first peak. This pattern signals a potential reversal in the market, as it indicates that buyers are failing to push the price higher, resulting in a double top formation.
Traders can use various techniques to identify and confirm the Double Top pattern. One widely-used method is to draw trendlines connecting the peaks of the two tops. This helps to visualize the pattern more clearly and provides a reference point for potential entry and exit levels. Additionally, traders can also look for other technical indicators, such as volume and oscillators, to validate the pattern further.
Once the Double Top pattern is confirmed, traders can enter short positions with a stop loss above the second peak and a take profit level equal to the distance between the first peak and the retracement low. This technique allows traders to capitalize on the downward movement that typically follows the pattern formation. However, it is essential to remember that no pattern is 100% reliable, and risk management should always be a top priority.
Chart patterns play a crucial role in forex trading as they provide traders with valuable information about the market’s direction and potential future price movements. By recognizing and understanding these patterns, traders can make informed decisions and increase their chances of success.
There are several types of chart patterns that traders commonly use, including trend continuation patterns, trend reversal patterns, and consolidation patterns. Each pattern has its own characteristics and provides different signals to traders.
Trend continuation patterns, like the flag pattern and the pennant pattern, occur when a currency pair is in a strong uptrend or downtrend and takes a brief pause before resuming its previous direction. These patterns indicate that the prevailing trend is likely to continue and present opportunities for traders to enter or add to their positions.
Trend reversal patterns, like the head and shoulders pattern and the double top pattern, occur when a currency pair is at the end of a trend and is about to reverse its direction. These patterns signal a potential trend reversal and provide traders with opportunities to exit their positions or even open new positions in the opposite direction.
Consolidation patterns, like the symmetrical triangle pattern and the rectangle pattern, occur when a currency pair enters a period of indecision and trades within a defined range. These patterns indicate a temporary pause in the prevailing trend and suggest that the market is gathering momentum for its next move. Traders can use these patterns to identify potential breakout opportunities.
It’s important to note that chart patterns are not foolproof and should be used in conjunction with other technical analysis tools and indicators. Traders should also be aware of the risks involved in forex trading and use proper risk management strategies.
In conclusion, chart patterns are powerful tools for forex traders as they provide valuable insights into market trends and potential price movements. By studying and identifying these patterns, traders can improve their decision-making process and increase their chances of success.

In forex trading, chart patterns are technical analysis tools that can help traders identify potential price movements and make informed trading decisions. These patterns are formed by the price movements on a forex chart and can provide valuable insights into market trends and reversals.
Key Information: Chart patterns are formed by the price movements on a forex chart and can help traders identify potential price movements and market trends.
Read Also: Is Trading in Stock Options a Good Idea? Explore the Pros and Cons
Types of Chart Patterns: There are several types of chart patterns in forex trading, including trend continuation patterns, trend reversal patterns, and consolidation patterns.
Trend Continuation Patterns: Trend continuation patterns indicate that the current trend is likely to continue in the same direction. Some common trend continuation patterns include the flag pattern, pennant pattern, and triangle pattern.
Flag Pattern: The flag pattern is formed by a sharp price movement, followed by a period of consolidation. This pattern indicates that the market is taking a pause before continuing the previous trend.
Pennant Pattern: The pennant pattern is similar to the flag pattern and is characterized by a small symmetrical triangle. This pattern indicates a continuation of the previous trend.
Triangle Pattern: The triangle pattern can be ascending, descending, or symmetrical. It represents a period of consolidation before the price breaks out in the direction of the previous trend.
Trend Reversal Patterns: Trend reversal patterns indicate that the current trend is likely to reverse. Some common trend reversal patterns include the head and shoulders pattern, double top pattern, and double bottom pattern.
Head and Shoulders Pattern: The head and shoulders pattern consists of three peaks, with the middle peak (head) being higher than the other two (shoulders). This pattern indicates a potential reversal from an uptrend to a downtrend.
Double Top Pattern: The double top pattern occurs when the price reaches a resistance level twice and fails to break above it. This pattern suggests a potential reversal from an uptrend to a downtrend.
Read Also: Discover the methods to calculate the real exchange rate accurately
Double Bottom Pattern: The double bottom pattern is the opposite of the double top pattern. It occurs when the price reaches a support level twice and fails to break below it. This pattern suggests a potential reversal from a downtrend to an uptrend.
Consolidation Patterns: Consolidation patterns occur when the price moves within a range, indicating a period of indecision in the market. Some common consolidation patterns include rectangles, wedges, and triangles.

Rectangle Pattern: The rectangle pattern is formed by horizontal support and resistance levels. It indicates a period of indecision before the price breaks out in either direction.
Wedge Pattern: The wedge pattern is characterized by converging trend lines. It can be ascending or descending and represents a period of indecision before a potential breakout in the direction of the previous trend.
Triangle Pattern: The triangle pattern in consolidation patterns is similar to the triangle pattern in trend continuation patterns. It represents a period of consolidation and indecision before a breakout in either direction.
By understanding and recognizing these chart patterns, forex traders can gain valuable insights into market trends and reversals. They can use this information to make informed trading decisions and improve their chances of success in the forex market.
The most accurate chart pattern in forex is considered to be the double top or double bottom pattern. This pattern occurs when the price reaches a high or low point and then retraces before making a second attempt to break through that level. It is considered reliable because it provides a clear entry point, stop-loss level, and target price.
To identify a double top pattern, you need to look for two highs at a similar level with a retracement between them. On the other hand, a double bottom pattern is identified by two lows at a similar level with a retracement between them. These patterns can be spotted on a price chart by connecting the highs or lows and observing the retracement in between.
Yes, other chart patterns that are considered accurate in forex trading include the head and shoulders pattern, symmetrical triangle pattern, and ascending or descending triangle pattern. These patterns provide traders with potential entry and exit points, as well as levels to set stop-loss and take-profit orders.
No, chart patterns alone cannot guarantee profitable trades in forex. While chart patterns provide traders with potential entry and exit points, they should be used in conjunction with other technical analysis tools, such as indicators and support/resistance levels. It is important to consider other factors, such as market conditions and news events, when making trading decisions.
Some techniques that can help improve the accuracy of chart pattern analysis include waiting for confirmation before taking a trade, using multiple time frames to confirm patterns, and combining chart patterns with other technical analysis tools. Additionally, it is important to practice proper risk management and have a trading plan in place to maximize the effectiveness of chart pattern analysis.
A chart pattern in forex trading is a recognizable pattern or formation on a price chart that indicates a potential future price movement. Traders use chart patterns to identify possible entry and exit points in the market.

The Meaning of Clearing in Trading Clearing is an essential process in the financial markets that ensures the smooth and efficient settlement of …
Read Article
Types of Global Trade: Exploring the 2 Main Categories Global trade plays a crucial role in the world economy, connecting countries and facilitating …
Read Article
Understanding FPV Trade: A Comprehensive Guide FPV trade, also known as First Person View trade, is a rapidly growing industry that combines the …
Read Article
What is the most stable currency in 2023? As we head into the new year, many economists and financial experts are busy making predictions about the …
Read Article
Simple Moving Average (SMA) in Python If you’re interested in quantitative trading or financial analysis, understanding how to calculate simple moving …
Read Article
Best Indicator for Meta 4: A Comprehensive Guide When it comes to trading on the Meta 4 platform, having the right indicators can make a world of …
Read Article


