


Understanding Level 3 Options: Everything You Need to Know | Website Name
What is Level 3 Options? Level 3 options are a type of financial derivative that allow investors to take on more complex and sophisticated trading …
Read Article
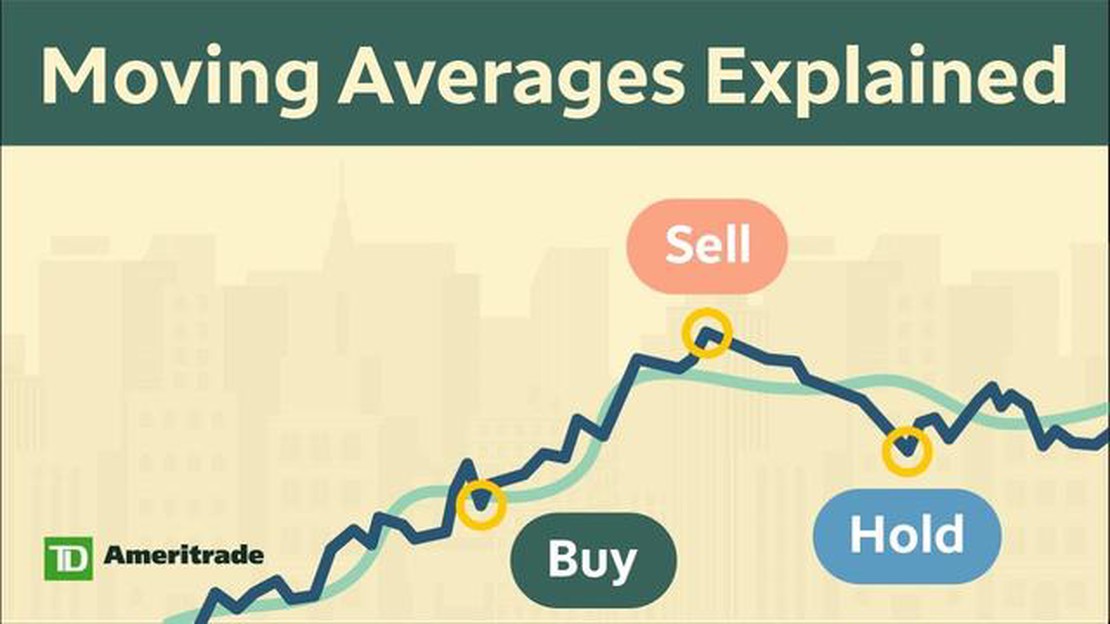
When it comes to technical analysis in trading, one of the most widely used indicators is the moving average. The moving average is a trend-following indicator that helps traders identify the overall direction of price movement. There are different types of moving averages, but in this article, we will focus on three popular ones: the 20, 50, and 200 moving averages.
The 20 moving average, also known as the short-term moving average, calculates the average price of an asset over the past 20 periods. This moving average is commonly used by traders to identify short-term trends and potential entry or exit points. When the price is above the 20 moving average, it is considered a bullish signal, indicating that the asset may continue to rise. On the other hand, when the price is below the 20 moving average, it is seen as a bearish signal, suggesting that the asset may continue to decline.
The 50 moving average, also known as the medium-term moving average, calculates the average price of an asset over the past 50 periods. This moving average is often used by traders to identify medium-term trends and confirm the strength of a trend. If the price is consistently above the 50 moving average, it is seen as a bullish signal, indicating that the asset is in an uptrend. Conversely, if the price consistently stays below the 50 moving average, it is considered a bearish signal, suggesting that the asset is in a downtrend.
The 200 moving average, also known as the long-term moving average, calculates the average price of an asset over the past 200 periods. This moving average is widely used by traders to identify the long-term direction of an asset and filter out short-term noise. When the price is above the 200 moving average, it is considered a bullish signal, indicating that the asset is in a long-term uptrend. Conversely, when the price is below the 200 moving average, it is seen as a bearish signal, suggesting that the asset is in a long-term downtrend.
In conclusion, the 20, 50, and 200 moving averages are important tools for traders in understanding the overall direction and strength of a trend. By using these moving averages in combination with other technical indicators, traders can make more informed trading decisions and increase their chances of success in the market.
In trading, the moving average is a commonly used technical indicator that helps traders identify trends and potential entry or exit points in the market. It is calculated by averaging the prices of a specific security over a defined period of time.
The moving average is used to smooth out price fluctuations and provide a clearer picture of the overall trend. It is often used in conjunction with other technical indicators to confirm or validate trading signals.
There are different types of moving averages that traders use, including the 20-day, 50-day, and 200-day moving averages. These are commonly used time periods and can provide insights into short-term, medium-term, and long-term trends respectively.

Traders often look for crossovers between moving averages as a signal to enter or exit trades. For example, when the shorter-term moving average (e.g., 20-day) crosses above the longer-term moving average (e.g., 50-day), it may indicate a bullish trend and a potential buying opportunity. Conversely, when the shorter-term moving average crosses below the longer-term moving average, it may indicate a bearish trend and a potential selling opportunity.
It’s important to note that moving averages are lagging indicators, meaning they are based on past price data. They may not always accurately predict future price movements and should be used in conjunction with other analysis techniques.
Read Also: The 2 Strongest Currencies: A Guide to Global Currency Strength
| Time Period | Type of Moving Average | Used for |
|---|---|---|
| 20 days | Short-term moving average | Identifying short-term trends and entry/exit points |
| 50 days | Medium-term moving average | Confirming medium-term trends |
| 200 days | Long-term moving average | Identifying long-term trends and support/resistance levels |
The 20, 50, and 200 moving averages are popular technical indicators used in trading. They are used to identify trends and potential support and resistance levels in a financial instrument’s price movement. Understanding these moving averages can help traders make informed decisions about buying or selling assets.
The 20-day moving average (MA) is a short-term indicator that calculates the average price of an asset over the past 20 trading days. It is sensitive to recent price changes and provides a more immediate reflection of the market sentiment. Traders often use the 20-day MA to identify short-term trends and potential entry or exit points for trades.
The 50-day moving average is an intermediate-term indicator that calculates the average price of an asset over the past 50 trading days. It smooths out short-term price fluctuations and provides a clearer picture of the overall trend. Traders commonly use the 50-day MA to identify medium-term trends and confirm the strength of a trend identified by the 20-day MA.
The 200-day moving average is a long-term indicator that calculates the average price of an asset over the past 200 trading days. It is less sensitive to short-term price movements and provides a broader perspective on the market trend. The 200-day MA is widely regarded as a significant support or resistance level. Traders often use it to identify long-term trends and potential reversal points.
When the price of an asset is above the 20-day, 50-day, and 200-day moving averages, it is considered bullish, indicating an upward trend. Conversely, when the price is below these moving averages, it is considered bearish, indicating a downward trend.
Read Also: Why is the Polish Zloty Strengthening? | Factors Behind the Rise of the Polish Currency
Traders may also use the crossovers of these moving averages to generate trading signals. For example, when the 20-day MA crosses above the 50-day MA, it may signal a buy opportunity as it suggests a potential shift in market sentiment towards an upward trend. Conversely, when the 20-day MA crosses below the 50-day MA, it may signal a sell opportunity as it indicates a potential shift towards a downward trend.
It is important to note that moving averages are lagging indicators, meaning they are calculated based on past price data. Therefore, they may not always accurately predict future price movements. It is advisable to use moving averages in conjunction with other technical indicators and analysis tools to make well-informed trading decisions.

In conclusion, understanding the 20, 50, and 200 moving averages is essential for traders as they provide valuable insights into short-term, medium-term, and long-term trends in a financial instrument’s price movement. By using these indicators effectively, traders can identify potential entry or exit points and make informed trading decisions.
The 20, 50, and 200 Moving Average are technical indicators used in trading to smooth out price data and identify trends. The 20 Moving Average calculates the average closing price over the past 20 periods, the 50 Moving Average calculates the average closing price over the past 50 periods, and the 200 Moving Average calculates the average closing price over the past 200 periods.
Moving Averages are used in various ways in trading. Traders often look at the relationship between the price and the Moving Averages to determine the strength of a trend. For example, if the price is above the 20, 50, and 200 Moving Average, it is typically considered as a bullish signal. Conversely, if the price is below the Moving Averages, it is usually seen as a bearish signal. Traders also use Moving Averages to generate buy and sell signals, such as when the price crosses above or below a Moving Average.
The 20, 50, and 200 periods are commonly used for Moving Averages because they represent short-term, medium-term, and long-term trends respectively. The 20-period Moving Average gives a more sensitive representation of short-term price movements, the 50-period Moving Average provides a smoother picture of the medium-term trend, and the 200-period Moving Average reflects the long-term trend. Using these three timeframes allows traders to gain a comprehensive understanding of the market’s trend.
Yes, Moving Averages are often used in conjunction with other technical indicators to enhance trading decisions. Traders may use indicators such as the Relative Strength Index (RSI), MACD, or Stochastic Oscillator alongside Moving Averages to confirm signals or identify potential reversals. Combining different indicators can provide a more comprehensive analysis of market conditions and increase the probability of successful trades.
While Moving Averages can be helpful in identifying trends and generating trading signals, they are not foolproof and have some limitations. Moving Averages are lagging indicators, meaning they are based on past price data and may not accurately predict future price movements. In volatile or choppy markets, Moving Averages can produce false signals. Additionally, Moving Averages may not work well in markets with no clear trend or during periods of significant news events that can cause sudden price movements. Traders should use Moving Averages in conjunction with other indicators and tools to make well-informed trading decisions.
A moving average in trading is a trend-following indicator that is used to smooth out price data and identify trends. It is calculated by taking the average of a certain number of past prices over a specified period of time.

What is Level 3 Options? Level 3 options are a type of financial derivative that allow investors to take on more complex and sophisticated trading …
Read Article
Understanding .01 Lot Size in Forex Trading Forex trading involves the buying and selling of currencies, with the aim of making a profit from the …
Read Article
Understanding Spot Purchase Contracts A spot purchase contract is a type of agreement between a buyer and a seller for the immediate purchase of goods …
Read Article
Can you become a millionaire with forex? Forex trading has become increasingly popular in recent years as more and more people are looking for ways to …
Read Article
What is the maximum leverage in CMS Prime? Are you looking to maximize your trades? Look no further than CMS Prime. With our cutting-edge trading …
Read Article
Best ways to transfer money to Australia Transferring money to Australia can be a complex process, but with the right method, it can be simple and …
Read Article


