

Understanding the Momentum Meter Indicator: How It Works and How to Use It
Understanding the Momentum Meter Indicator The Momentum Meter is an important technical indicator that allows traders to gauge the strength and …
Read Article
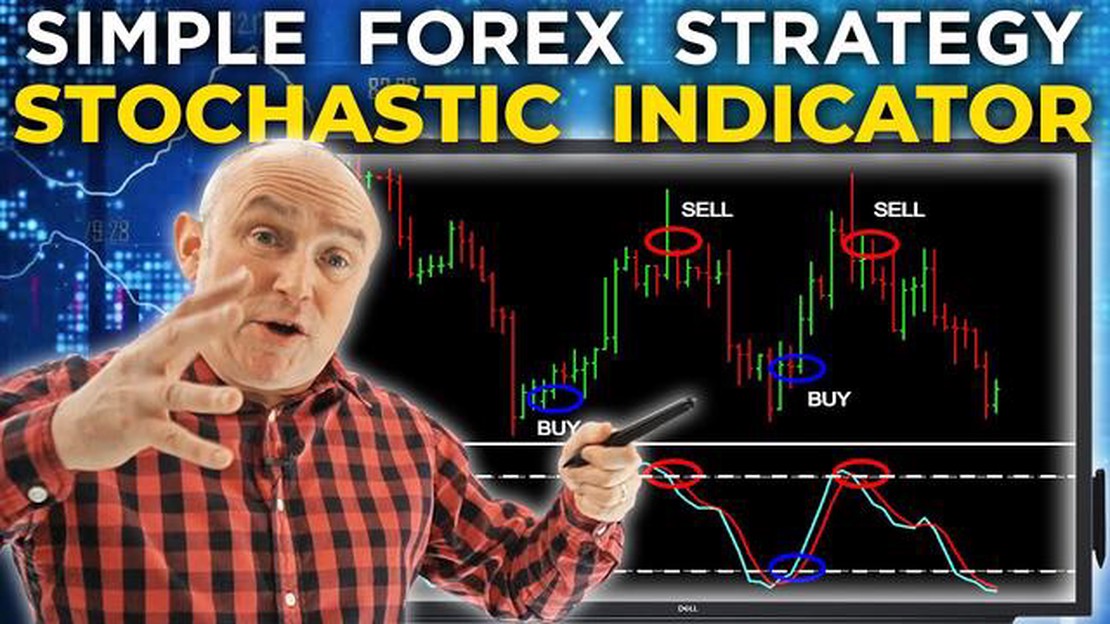
The Stochastic Oscillator is a popular technical analysis tool used by forex traders to identify potential trading opportunities. It is a momentum indicator that compares the closing price of an asset to its price range over a specific period of time. The Stochastic Oscillator consists of two lines - %K and %D - that oscillate between 0 and 100, indicating overbought and oversold conditions in the market.
To effectively use the Stochastic Oscillator in forex trading, traders should first understand how it works. When the %K line crosses above the %D line and both are below 20, it suggests that the asset is oversold and a potential buying opportunity may arise. Conversely, when the %K line crosses below the %D line and both are above 80, it suggests that the asset is overbought and a potential selling opportunity may arise.
Example: If the %K line crosses above the %D line and both are below 20, it indicates that the asset is oversold and a trader may consider buying the asset. However, it is important to consider other technical indicators and fundamental analysis before making a trading decision.
In addition to identifying overbought and oversold conditions, the Stochastic Oscillator can also be used to confirm trends. When the %K line crosses above the %D line and both are above 50, it suggests a bullish trend. On the other hand, when the %K line crosses below the %D line and both are below 50, it suggests a bearish trend.
It is important to note that the Stochastic Oscillator is not infallible and should be used in conjunction with other technical indicators and risk management strategies. Traders should also be aware of false signals and consider market conditions before making trading decisions based solely on the Stochastic Oscillator.
By understanding how to use the Stochastic Oscillator and incorporating it into their trading strategies, forex traders can potentially increase their chances of making profitable trades. However, it is important to practice and refine the understanding of this indicator through backtesting and demo trading before using it in live trading.
The Stochastic Oscillator is a technical analysis indicator that was developed by George Lane in the 1950s. It is a momentum indicator that shows the location of the current closing price relative to the high-low range over a set number of periods, usually 14.
The Stochastic Oscillator consists of two lines - %K and %D. The %K line is the main line that represents the current closing price compared to the recent price range. The %D line, also known as the signal line, is a moving average of the %K line. The Stochastic Oscillator is displayed as a range-bound indicator that fluctuates between 0 and 100.
The Stochastic Oscillator is used to identify overbought and oversold conditions in the market. Traders often look for divergences between the price and the Stochastic Oscillator, as these can signal potential trend reversals. Crosses of the %K and %D lines can also provide buy and sell signals.

Traders can adjust the Stochastic Oscillator to their trading style and the time frame they are trading. They can change the number of periods used in the calculation, as well as the overbought and oversold levels.
The Stochastic Oscillator is a versatile tool that can be used on its own or in conjunction with other indicators to make better-informed trading decisions. It is important to note that like any indicator, the Stochastic Oscillator should not be used in isolation, but rather as part of a comprehensive trading strategy.
The stochastic oscillator is a popular technical analysis tool used in forex trading to measure the momentum of a currency pair’s price. It compares the closing price of a currency pair to its price range over a given period of time, typically 14 periods.
The stochastic oscillator consists of two lines: the %K line and the %D line. The %K line is the faster line and the %D line is the slower line. These lines oscillate within a range from 0 to 100, representing overbought and oversold conditions in the market.
When the %K line crosses above the %D line and both lines are below 20, it indicates an oversold condition and may be considered a buying signal. Conversely, when the %K line crosses below the %D line and both lines are above 80, it indicates an overbought condition and may be considered a selling signal.
Read Also: How much is $1000 Singapore in USD? Learn the exchange rate with our currency converter
The stochastic oscillator can also be used to identify bullish and bearish divergences. A bullish divergence occurs when the price of a currency pair makes a lower low, but the stochastic oscillator makes a higher low. This indicates a potential reversal to the upside. Conversely, a bearish divergence occurs when the price makes a higher high, but the stochastic oscillator makes a lower high. This indicates a potential reversal to the downside.
Traders can use the stochastic oscillator in conjunction with other technical analysis tools, such as trendlines, support and resistance levels, and moving averages, to confirm trading signals and make more informed trading decisions.
The Stochastic Oscillator is a popular technical indicator used by Forex traders to identify overbought and oversold conditions in the market. It is a momentum indicator that compares the closing price of a currency pair to its price range over a given period of time. Using the Stochastic Oscillator can help traders make better trading decisions and improve their trading strategy.
Here is a step-by-step guide on how to use the Stochastic Oscillator in Forex trading:
Read Also: Understanding the Mechanisms of Forex Trading: Everything You Need to Know
Step 1: Open your trading platform and select the currency pair you want to trade.
Step 2: Go to the indicator section of your trading platform and select the Stochastic Oscillator from the list of available indicators.
Step 3: Set the parameters for the Stochastic Oscillator. The default parameters are usually 14 periods for the %K line and 3 periods for the %D line. You can adjust these parameters based on your trading strategy and time frame.
Step 4: Analyze the Stochastic Oscillator chart. The chart will show two lines, the %K line and the %D line, as well as two horizontal lines representing overbought and oversold levels. When the %K line crosses above the %D line and both lines are below the overbought level, it is a signal to buy. Conversely, when the %K line crosses below the %D line and both lines are above the oversold level, it is a signal to sell.
Step 5: Use the Stochastic Oscillator in conjunction with other technical indicators and analysis techniques to confirm your trading signals. This will help you filter out false signals and improve the accuracy of your trades.

Step 6: Place your trade based on the signals generated by the Stochastic Oscillator. Remember to set your stop-loss and take-profit levels to manage your risk effectively.
Step 7: Monitor your trade and adjust your stop-loss and take-profit levels as needed. You can also use the Stochastic Oscillator to identify potential exit points for your trade.
By following this step-by-step guide on using the Stochastic Oscillator, you can improve your trading skills and make better-informed trading decisions in the Forex market.
The Stochastic Oscillator is a technical indicator used to measure the momentum of price movements in forex trading. It compares the closing price of a currency pair to its price range over a specific period of time, helping traders identify overbought and oversold conditions in the market.
The Stochastic Oscillator consists of two lines - %K and %D. The %K line reflects the current closing price compared to the price range over the chosen period, while the %D line is a moving average of %K. Traders look for %K and %D line crossovers, as well as divergences with price, to generate buy or sell signals.
The Stochastic Oscillator can be used on various time frames, but it is most commonly used on the daily and hourly charts. The choice of time frame depends on the trader’s trading style and preferences. Shorter time frames may provide more frequent signals, but they can also be more prone to false signals.
The Stochastic Oscillator uses the concept of overbought and oversold conditions. When the %K line crosses above the %D line and both lines are in the overbought zone (above 80), it suggests a possible downward reversal. Conversely, when the %K line crosses below the %D line and both lines are in the oversold zone (below 20), it suggests a possible upward reversal.

Understanding the Momentum Meter Indicator The Momentum Meter is an important technical indicator that allows traders to gauge the strength and …
Read Article
Using American Money in Norway: What You Need to Know Planning to visit Norway and wondering if you can use American currency during your trip? Here’s …
Read Article
Understanding the Guppy Multiple Moving Average in MT5 The Guppy Multiple Moving Average (GMMA) is a popular technical analysis indicator used in …
Read Article
Tracking my ESPP in Quicken: A Step-by-Step Guide If you have an Employee Stock Purchase Plan (ESPP) and use Quicken to manage your finances, it is …
Read Article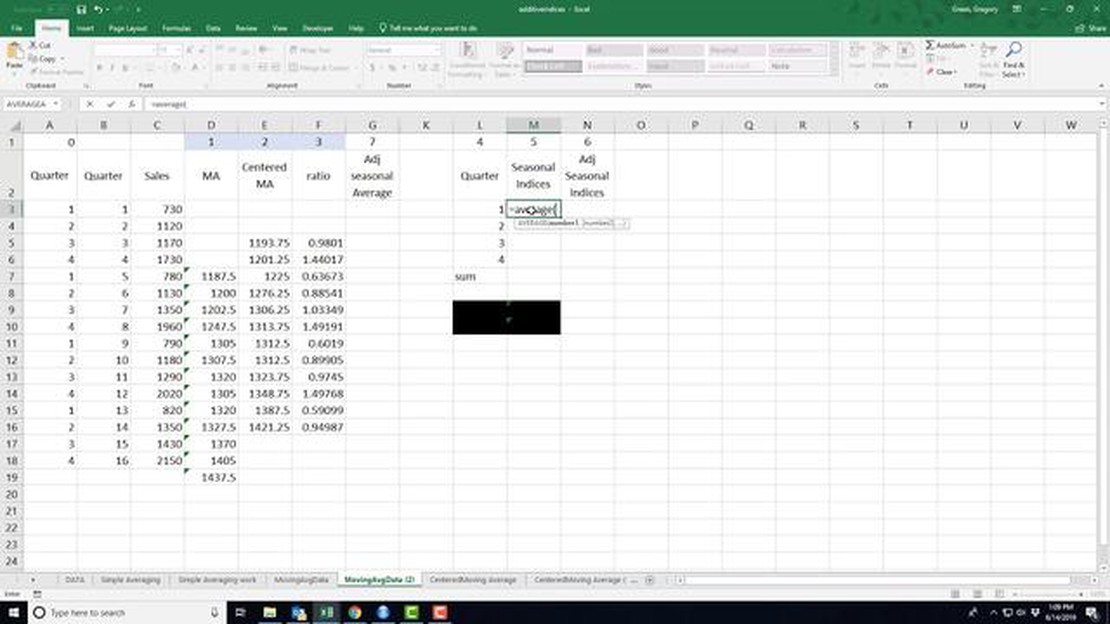
How to Calculate Centered Moving Average in Excel Introduction The centered moving average is a commonly used statistical method for smoothing time …
Read Article
Trading SPX Options After Hours Trading SPX options after hours can be an exciting and potentially lucrative opportunity for investors. While the …
Read Article


