


How to Account for a Call Option: A Comprehensive Guide
Accounting for Call Options: A Comprehensive Guide Call options are financial instruments that give the holder the right, but not the obligation, to …
Read Article

When it comes to intraday trading, one of the key indicators used by traders is the Exponential Moving Average (EMA). The EMA helps traders identify the direction of a trend and potential trading opportunities. However, determining the optimal EMA period can be challenging, as different periods can yield different results.
In this article, we will explore the concept of EMA and how it can be used to enhance intraday trading strategies. We will also discuss the importance of finding the best fit EMA period based on market conditions and trading goals. By understanding the factors that affect the optimal EMA period, traders can make more informed decisions and improve their trading performance.
EMA is a type of moving average that gives more weight to recent price data, making it more responsive to price changes. This makes it particularly useful for short-term traders who want to capture quick market movements. However, choosing the right EMA period is crucial, as a period that is too short may generate false signals, while a period that is too long may lag behind the market.
To find the optimal EMA period for intraday trading, traders need to consider factors such as the time frame of their trades, the volatility of the market, and their risk tolerance. By experimenting with different EMA periods and observing how they perform in different market conditions, traders can find the best fit EMA period that suits their trading style and objectives.
When it comes to intraday trading, finding the optimal EMA period can be crucial for determining entry and exit points. The EMA (Exponential Moving Average) is a popular technical indicator used by many traders to identify trends and potential reversals in the market.
There is no one-size-fits-all answer to the question of what the ideal EMA period is. The optimal period can vary depending on various factors such as the timeframe being traded, the volatility of the market, and the trading strategy being used.
One approach to determining the ideal EMA period is to experiment with different periods and observe how they perform in different market conditions. By backtesting different EMA periods on historical data, traders can get a sense of how well each period captures price movements and generates trading signals.

Another method is to use a combination of multiple EMAs with different periods. For example, some traders use a shorter EMA period, such as 9 or 12, to capture short-term trends, and a longer EMA period, such as 26 or 50, to capture longer-term trends. The intersection of these two EMAs can be used as a signal for potential entry or exit points.
It’s important to note that the ideal EMA period can also change over time as market conditions evolve. What may work well in a trending market may not work as effectively in a range-bound or volatile market. Therefore, it’s crucial for traders to regularly evaluate and adjust their EMA period to ensure it remains optimal for their trading strategy.
In conclusion, determining the ideal EMA period for intraday trading requires experimentation, backtesting, and a deep understanding of market conditions. By finding the right EMA period, traders can increase their chances of identifying profitable trading opportunities and making informed trading decisions.
Before implementing any trading strategy, it is crucial to test it on historical data to evaluate its performance. In the case of determining the optimal EMA period for intraday trading, this testing process is essential to determine which period provides the best fit for the chosen market.
Read Also: Are Binary Options Profitable? Discover How You Can Make Money Trading Binary Options
To conduct this test, a set of historical price data is required. This data should cover a significant period of time, ideally encompassing different market conditions. By using a variety of historical data, the test will provide a more accurate assessment of the EMA period’s effectiveness.
Once the historical data is obtained, the next step is to calculate the EMA for different periods. This can be done using a spreadsheet software or programming language specifically designed for data analysis. By calculating the EMA for various periods, such as 5, 10, 20, and 50, the trader can compare and contrast the performance of each period.
Read Also: Learn about the originators of Bollinger Bands and their contribution to technical analysis
The performance comparison can be accomplished by analyzing various factors, such as profitability, drawdown, and risk-reward ratio. These factors help determine which EMA period yields the greatest potential for profit while minimizing risk. By assessing these factors for each period, the trader can make an informed decision about which EMA period to use in their intraday trading strategy.
It is important to note that testing the EMA period on historical data should be an iterative process. Traders should not only test different periods but also adjust them based on market conditions. As market conditions change, the optimal EMA period might also shift.
By testing the EMA period on historical data, traders can gain valuable insights into the effectiveness of this technical indicator for intraday trading. This testing process allows traders to make informed decisions about the optimal EMA period that aligns with their trading goals and objectives.
| EMA Period | Profitability | Drawdown | Risk-Reward Ratio |
|---|---|---|---|
| 5 | … | … | … |
| 10 | … | … | … |
| 20 | … | … | … |
| 50 | … | … | … |

The EMA period refers to the number of time periods used in calculating the Exponential Moving Average (EMA). It determines the weight given to each data point in the calculation.
The EMA period can influence intraday trading by affecting the sensitivity and the speed at which the EMA reacts to price changes. Shorter EMA periods can provide more timely signals, but may also generate more false signals. Longer EMA periods can help filter out noise, but may also lag behind actual price movements.
There is no one-size-fits-all answer to this question, as the optimal EMA period for intraday trading depends on various factors such as the trading instrument, market conditions, and personal trading style. Traders often try different EMA periods and use trial and error to find the one that works best for them.
Yes, there are some commonly used EMA periods for intraday trading, such as 9, 13, or 20. These periods are often used as they provide a good balance between timely signals and filtering out noise.
Traders often combine EMA with other technical indicators such as MACD, RSI, or Bollinger Bands to get a more comprehensive view of the market and to confirm signals. These indicators can provide additional insights and help traders make more informed trading decisions.

Accounting for Call Options: A Comprehensive Guide Call options are financial instruments that give the holder the right, but not the obligation, to …
Read Article
2023 Market Holidays: How Many Days Off Do You Have? As the year 2023 approaches, investors and traders are already planning for the upcoming market …
Read Article
Automating Forex: Can It Be Done? Forex trading, also known as foreign exchange trading, is a global decentralized market where currencies are traded. …
Read Article
Types of Options Traded on NSE Options trading is a popular method of investing in the stock market. It provides traders with the opportunity to …
Read Article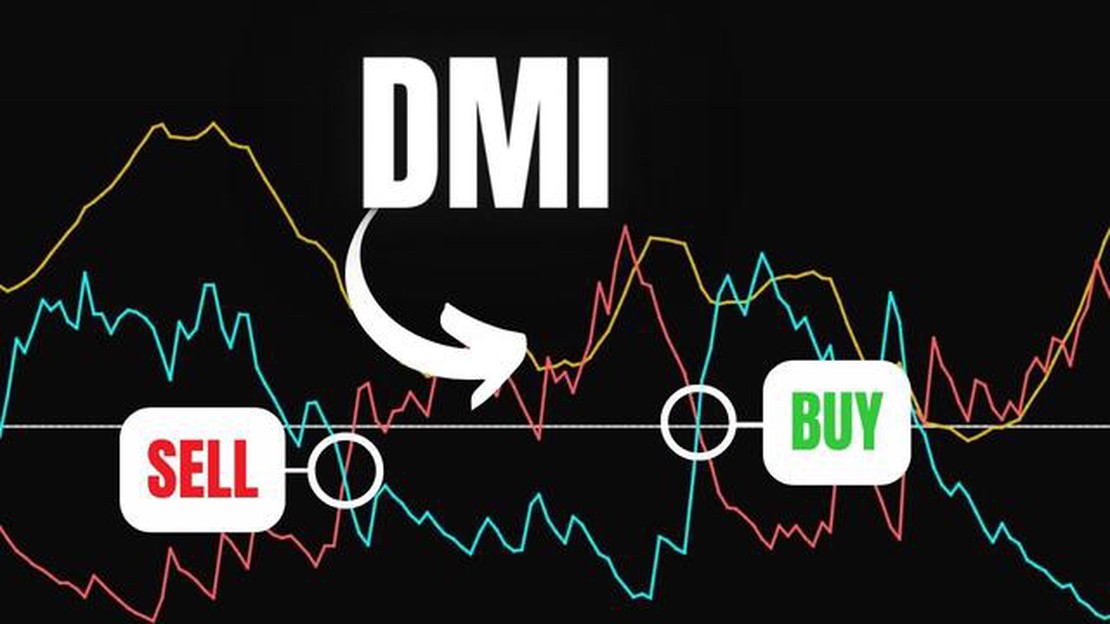
Trading with DMI Indicator: A Comprehensive Guide The Directional Movement Index (DMI) is a popular technical analysis indicator that is used to …
Read Article
Best Broker for Beginners Choosing the right broker is one of the first and most important steps for beginners in the world of online trading. With so …
Read Article


