Understanding the Effects of a 200 EMA Crossing 50 EMA
Technical analysis plays a crucial role in the decision-making process of traders. One commonly used indicator in technical analysis is the Exponential Moving Average (EMA). The EMA is calculated by placing more weight on recent data points, making it more responsive to price changes compared to the Simple Moving Average (SMA).
Table Of Contents
In this article, we will explore the impact of the 200 EMA crossing the 50 EMA on trading. The 200 EMA and 50 EMA are two commonly used EMAs by traders to identify trends and potential trading opportunities. When the shorter-term 50 EMA crosses above or below the longer-term 200 EMA, it is often considered a bullish or bearish signal, respectively.
The crossing of the 200 EMA and the 50 EMA is believed to signify a change in the overall trend of a financial instrument. Traders often view this crossover as a confirmation of a potential trend reversal or continuation. If the 50 EMA crosses above the 200 EMA, it is considered a bullish signal, suggesting that the price may continue to increase. On the other hand, if the 50 EMA crosses below the 200 EMA, it is seen as a bearish signal, indicating that the price may continue to decrease.
It is important to note that the 200 EMA crossing the 50 EMA should not be the sole basis for making trading decisions. Traders often combine this signal with other technical indicators and chart patterns to increase the probability of success. Additionally, it is crucial to consider other factors such as market conditions, volume, and fundamental analysis to make informed trading decisions.
Understanding the Impact of EMA Crossovers on Trading
EMA (Exponential Moving Average) crossovers are a popular technical analysis tool used by traders to identify potential entry and exit points in the market. This strategy involves tracking the intersection of two EMAs, typically the 50 EMA and the 200 EMA, to determine the direction of the trend and make trading decisions accordingly.
When the 200 EMA crosses above the 50 EMA, it is considered a bullish signal, indicating a potential upward trend. This crossover suggests that the longer-term moving average (200 EMA) is starting to trend higher, and the shorter-term moving average (50 EMA) is catching up. Traders may interpret this as a buying opportunity, as it suggests that the market may continue to move upwards.
On the other hand, when the 200 EMA crosses below the 50 EMA, it is considered a bearish signal, indicating a potential downward trend. This crossover suggests that the longer-term moving average is starting to trend lower, and the shorter-term moving average is catching up from above. Traders may interpret this as a selling opportunity, as it suggests that the market may continue to move downwards.
However, it is important to note that EMA crossovers are not foolproof and should be used in conjunction with other technical indicators and analysis tools. False signals can occur, resulting in losses if traders solely rely on EMA crossovers for their trading decisions.
Additionally, the impact of EMA crossovers may vary depending on the time frame and market conditions. Short-term traders may focus on shorter-term EMAs, such as the 20 EMA and the 50 EMA, while long-term traders may use longer-term EMAs, such as the 100 EMA and the 200 EMA. Market volatility, volume, and other factors also play a role in the effectiveness of EMA crossovers.
To maximize the effectiveness of EMA crossovers, traders often use additional tools, such as support and resistance levels, trendlines, and momentum indicators. These tools can provide confirmation or divergence signals, helping traders make more informed trading decisions.
In conclusion, EMA crossovers can be a valuable tool for traders to identify potential entry and exit points in the market. However, they should not be solely relied upon and should be used in conjunction with other technical analysis tools. Understanding the impact of EMA crossovers on trading requires knowledge of market conditions, timeframes, and the use of additional indicators for confirmation.
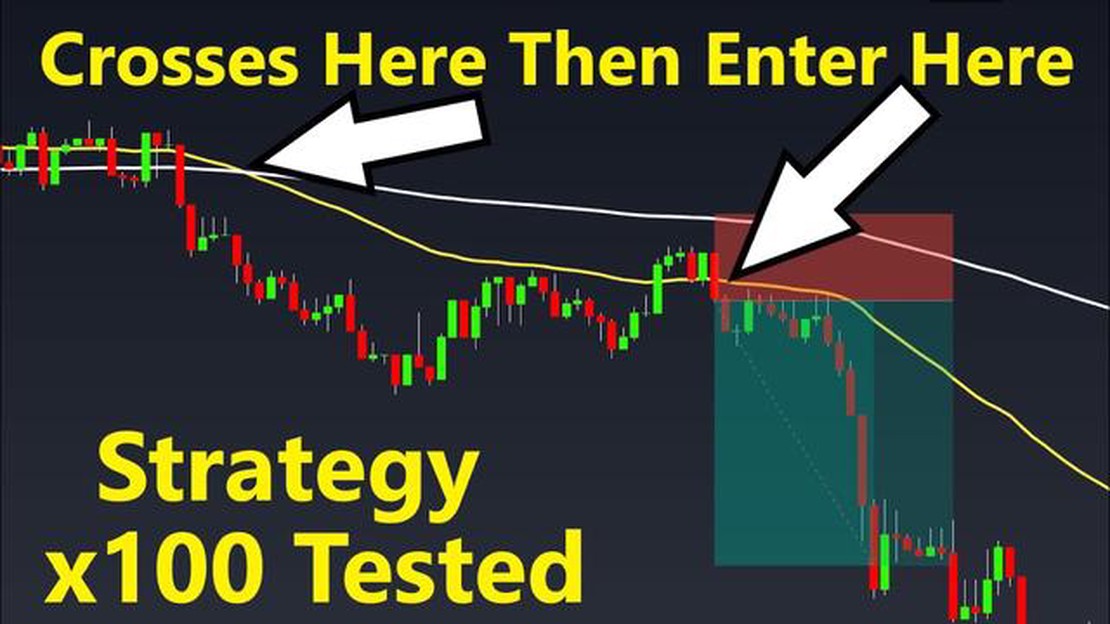
A Closer Look at the 200 EMA Crossing the 50 EMA
When it comes to trading, technical analysis plays a crucial role in making informed decisions. One popular technical indicator that traders often rely on is the Exponential Moving Average (EMA). The EMA is a trend-following indicator that smooths out price data over a specific period of time, giving traders a better understanding of the market’s overall trend.
In particular, many traders pay close attention to the crossover of two EMAs: the 200 EMA and the 50 EMA. When the 200 EMA crosses above the 50 EMA, it is considered a bullish signal, indicating a potential buy opportunity. Conversely, when the 200 EMA crosses below the 50 EMA, it is seen as a bearish signal, suggesting a possible sell opportunity.
The significance of the 200 EMA crossing the 50 EMA lies in its ability to confirm or validate a trend reversal. As the 200 EMA represents a longer-term trend and the 50 EMA represents a shorter-term trend, their crossover indicates a shift in market sentiment. This crossover is often used as a trigger for traders to enter or exit positions, depending on the direction of the crossover.
It is important to note that the 200 EMA crossing the 50 EMA should not be used as the sole basis for trading decisions. Like any technical indicator, it is not infallible and should be used in conjunction with other indicators and analysis techniques. Additionally, market conditions and the timeframe being analyzed should also be taken into consideration, as the significance of the crossover may vary.
Traders often use additional tools, such as support and resistance levels, volume indicators, and other technical indicators, to confirm the validity of a crossover signal. This helps minimize false signals and provides traders with a more reliable confirmation of a trend reversal.
To conclude, the crossover of the 200 EMA and the 50 EMA is a widely watched event in the trading community. Its ability to indicate a trend reversal makes it an important tool for traders to consider in their decision-making process. However, it should always be used in conjunction with other technical indicators and analysis methods to maximize its effectiveness.
FAQ:
What is the 200 EMA and the 50 EMA?
The 200 EMA and the 50 EMA are two popular moving averages used by traders to analyze the price trend of a security. The 200 EMA represents the average price of a security over the last 200 periods, while the 50 EMA represents the average price over the last 50 periods.
How can the crossing of the 200 EMA and the 50 EMA impact trading?
The crossing of the 200 EMA and the 50 EMA can indicate a potential change in the price trend of a security. If the 200 EMA crosses above the 50 EMA, it is considered a bullish signal, suggesting that the price may continue to rise. Conversely, if the 200 EMA crosses below the 50 EMA, it is considered a bearish signal, indicating that the price may decline.
Is the crossing of the 200 EMA and the 50 EMA a reliable signal for making trading decisions?
The crossing of the 200 EMA and the 50 EMA is just one of many indicators used by traders to make trading decisions. While it can be a useful signal in certain market conditions, it is not foolproof and should be used in conjunction with other technical analysis tools and market research.
Can the crossing of the 200 EMA and the 50 EMA be used for both short-term and long-term trading?
Yes, the crossing of the 200 EMA and the 50 EMA can be used for both short-term and long-term trading. In short-term trading, traders may use the crossover as a trigger for entering or exiting a trade. In long-term trading, the crossover can help identify major trend reversals and potential market entry points.
Are there any drawbacks or limitations to using the crossing of the 200 EMA and the 50 EMA?
One potential drawback of using the crossing of the 200 EMA and the 50 EMA is that it may generate false signals during periods of market volatility or consolidation. Additionally, it is important to consider other factors such as market fundamentals and news events when making trading decisions, as the crossover alone may not provide a complete picture of the market conditions.
What does it mean when the 200 EMA crosses the 50 EMA in trading?
When the 200 EMA (Exponential Moving Average) crosses the 50 EMA in trading, it signifies a potential change in the trend. Specifically, when the 200 EMA moves above the 50 EMA, it is considered a bullish signal, indicating that the long-term trend is becoming stronger and prices may continue to rise. On the other hand, when the 200 EMA moves below the 50 EMA, it is seen as a bearish signal, suggesting that the long-term trend is weakening and prices may start to decline.
How can the crossing of the 200 EMA and 50 EMA be used to identify trading opportunities?
The crossing of the 200 EMA and 50 EMA can be used as a technical indicator to identify potential trading opportunities. Traders often look for a bullish crossover, where the 200 EMA moves above the 50 EMA, as a buy signal. This suggests that the bullish momentum is increasing and it may be a good time to enter a long position. Similarly, a bearish crossover, where the 200 EMA moves below the 50 EMA, can be seen as a sell signal, indicating that the bearish momentum is strengthening and it may be a time to consider shorting a security. However, it is important to note that trading decisions should not be solely based on this crossover, and other indicators and analysis should also be considered for a comprehensive trading strategy.
Mastering Intermarket Analysis: A Comprehensive Guide Intermarket analysis is a powerful tool that allows traders to analyze and predict the movements …
Best Ways to Invest $10,000 in Kenya Investing in Kenya can be an exciting opportunity for anyone looking to grow their wealth. With a diverse economy …
Number of Employees at Kayak Kayak, the popular travel search engine, has a substantial workforce that contributes to its success in the online travel …
Is gnuplot still being used? As one of the oldest graphing tools in the field of data visualization, Gnuplot has been around for decades. But with the …