


Mastering Forex Trading: The Secret to Consistent Profits
Strategies for Consistently Profiting in Forex Trading Forex trading, also known as foreign exchange trading, has become increasingly popular over the …
Read Article
When analyzing time series data, it’s often useful to identify trends or patterns that can help make predictions or inform decision-making. One commonly used method for smoothing out fluctuations and revealing underlying trends is the moving average.
The moving average is a statistical technique that calculates the average of a subset of data points over a specified time period, known as the window size. By taking the average of these subsets, the moving average provides a smoothed representation of the data, which can help to identify trends and patterns that may not be immediately apparent from the raw data.
To apply the moving average to data, the first step is to determine the window size. This is a crucial decision, as it determines the level of smoothing and the level of detail in the resulting moving average series. A smaller window size will result in a more responsive moving average, while a larger window size will provide a smoother representation but may smooth out smaller fluctuations.
Once the window size is determined, the next step is to calculate the moving average for each data point within the window. This is done by taking the average of the data points within the window and assigning this value to the corresponding point in the moving average series. This process is then repeated for each subsequent data point, recalculating the moving average with the updated subset of data.
The moving average can be a valuable tool for identifying trends and patterns in time series data. By smoothing out fluctuations and highlighting underlying trends, it can help to provide insights and make more informed decisions. Understanding the step-by-step process of applying the moving average can empower analysts and data scientists to leverage this technique effectively in their analyses.

Moving Average is a commonly used statistical method for analyzing and forecasting time series data. It helps to smooth out the fluctuations in the data and identify underlying trends or patterns.
The Moving Average is calculated by taking the average of a certain number of data points within a specific time period. The number of data points, also known as the window size or period, determines the level of smoothing. A smaller window size will result in more fluctuations, while a larger window size will result in a smoother trend line.
The Moving Average is often used in finance, economics, and other fields to analyze stock prices, sales data, economic indicators, and more. It can be used to identify trends, evaluate the performance of a stock, predict future values, and detect anomalies.
The Moving Average can be calculated using different methods, such as the Simple Moving Average (SMA), Exponential Moving Average (EMA), or Weighted Moving Average (WMA). Each method has its own advantages and disadvantages, and the choice depends on the specific requirements of the analysis.
Overall, the Moving Average is a valuable tool for understanding the underlying patterns in time series data and making informed decisions based on these patterns.
Read Also: Reasons to Consider Purchasing Out of the Money Options
There are several advantages to applying moving average to data:
Overall, applying moving average to data provides valuable insights into the trend, behavior, and potential future outcomes of the data. It is a widely used and effective technique in data analysis and financial trading.
Read Also: Track Your Stock Portfolio with These Top Apps
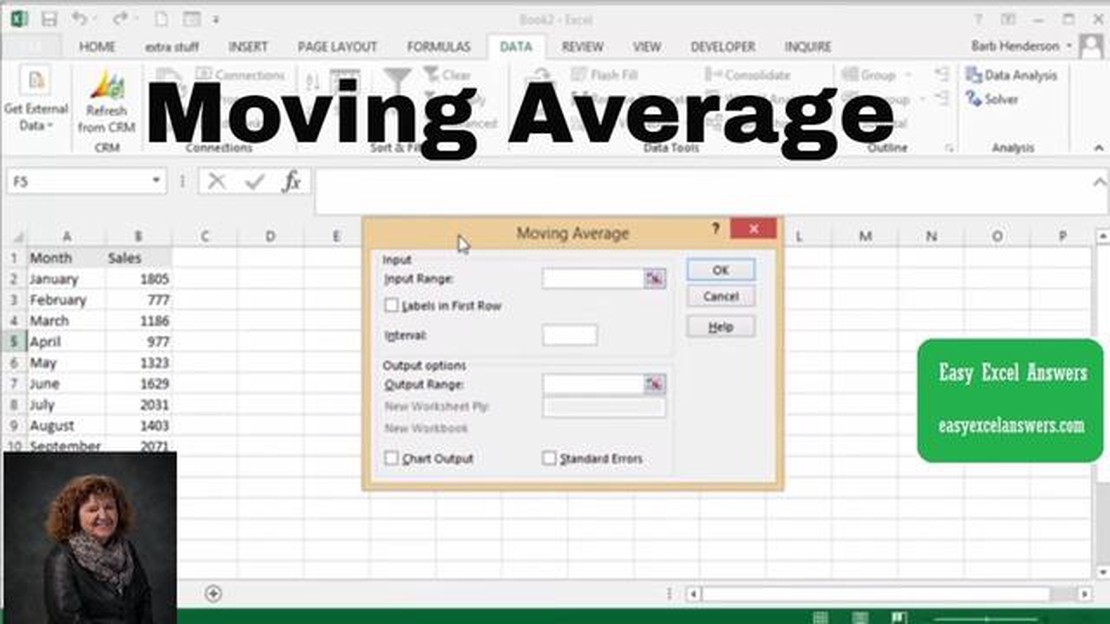
In this step-by-step guide, we will walk you through the process of applying moving average to your data. Follow the instructions below to get started:
| Step 1: | Gather your data. Make sure you have a set of values that you want to calculate the moving average for. |
| Step 2: | Decide on the time period for the moving average. This could be a specific number of days, months, or any other time unit that suits your needs. |
| Step 3: | Choose a window size for the moving average. This refers to the number of data points that will be included in each calculation. |
| Step 4: | Calculate the moving average for each data point. Start with the first data point and use the specified window size to determine the average. Repeat this process for each subsequent data point. |
| Step 5: | Plot the moving average on a graph, along with the original data points. This will help you visualize the trend and identify any patterns or outliers. |
| Step 6: | Analyze the results. Examine the moving average to see if it smooths out any fluctuations in the data and reveals any underlying trends. |
| Step 7: | Make any necessary adjustments. If the moving average is not providing the desired level of smoothing or trend identification, consider changing the time period or window size. |
| Step 8: | Repeat the process as needed. If you have new data or want to update the moving average, simply go back to step 1 and start again. |
By following this step-by-step guide, you can easily apply moving average to your data and gain valuable insights into its patterns and trends.
A moving average is a commonly used statistical calculation that helps smooth out fluctuations in data over a specific period of time.
Applying a moving average to your data can help in identifying trends and patterns that may not be immediately evident in the raw data. It can also help remove noise or random fluctuations, making it easier to identify underlying patterns.

To calculate a simple moving average, you need to choose a specific window size, which represents the number of data points you want to include in your average. Then, you sum up the data points within that window and divide by the window size to get the average value.
The main difference between a simple moving average and an exponential moving average is the way data points are weighted. In a simple moving average, all data points within the window have equal weight. In an exponential moving average, more recent data points have higher weight, with older data points having decreasing weight.
Yes, there are a few limitations to keep in mind. Moving averages may create lag in your data, as they are based on previous values. Additionally, the choice of window size can impact the results, with smaller windows providing more responsiveness to recent changes but potentially missing out on long-term trends, while larger windows may smooth out fluctuations but also delay the detection of new trends.
The purpose of applying a moving average to data is to smooth out short-term fluctuations or noise in the data and reveal the underlying trend or pattern. It helps in reducing the impact of outliers or random fluctuations, making it easier to identify long-term trends, cycles, or seasonality in the data. Additionally, moving averages can be used to forecast future values based on the historical behavior of the data.

Strategies for Consistently Profiting in Forex Trading Forex trading, also known as foreign exchange trading, has become increasingly popular over the …
Read Article
Setting up a Moving Average Crossover Strategy: A Step-by-Step Guide When it comes to trading in the financial markets, it’s important to have a …
Read Article
Understanding Margin Call in Forex Trading Forex trading involves buying and selling currencies in the foreign exchange market. One of the key aspects …
Read Article
Python for Technical Analysis: A Comprehensive Guide Technical analysis is a method used by traders and investors to analyze and predict future price …
Read Article
Why is it called hull? Have you ever wondered why the English city of Hull has such a unique name? The origin of the word “hull” can be traced back to …
Read Article
Merits and Limitations of Moving Average When it comes to analyzing financial data, moving averages are a commonly used tool that can provide valuable …
Read Article


