


Understanding Buying and Selling Pressure: Which Indicator to Watch
Best Indicator Showing Buying and Selling Pressure When it comes to trading in the stock market, understanding buying and selling pressure is crucial. …
Read Article

Trading can be an exciting and profitable venture if done correctly. One tool that traders often use is the Rate of Change (ROC) indicator. ROC is a momentum oscillator that measures the percentage change in price over a specified period of time. It can be a powerful tool for identifying trends and potential entry and exit points in the market.
In this complete guide, we will take a deep dive into ROC and explore how it is calculated, how to interpret its signals, and how to use it in your trading strategy. Whether you are a beginner looking to learn the basics of trading or an experienced trader looking to refine your skills, this guide will provide you with the knowledge and tools you need to effectively trade with ROC.
First, we will explain the formula used to calculate the Rate of Change and provide examples of how to calculate it manually. Next, we will discuss how to interpret ROC signals and identify potential buy and sell signals. We will also explore different time frames and settings for ROC, as well as how to use it in conjunction with other technical indicators.
Finally, we will provide practical tips and strategies for incorporating ROC into your trading routine. We will discuss risk management, position sizing, and how to set realistic expectations for your trading performance. By the end of this guide, you will have a solid understanding of ROC and how to use it effectively in your trading strategy.
Disclaimer: Trading involves significant risk and is not suitable for all investors. The information provided in this guide is for educational purposes only and should not be construed as financial advice. Always do your own research and consult with a professional before making any trading or investment decisions.
The Rate of Change (ROC) is a popular technical indicator used by traders to measure the price momentum of a financial instrument. It calculates the percentage change in price over a specified period of time, which can help traders identify trends and potential buying or selling opportunities.
ROC is calculated by taking the current price and dividing it by the price from a certain number of periods ago. The result is then multiplied by 100 to get the percentage change. Traders can choose the number of periods they want to use for the calculation, with shorter periods giving more responsive readings and longer periods providing a smoother trend.

Positive ROC values indicate that the price is increasing, while negative values indicate a price decrease. The magnitude of the ROC indicates the strength of the price movement. A higher ROC suggests a stronger trend, while a lower ROC indicates weaker price momentum.
Traders often use ROC in conjunction with other technical indicators or chart patterns to confirm trading signals. For example, if the ROC is positive and the price is also above a moving average, it could be a bullish signal. Conversely, if the ROC is negative and the price is below a moving average, it could be a bearish signal.
It’s important to note that ROC is just one tool in a trader’s toolbox and should not be used in isolation. It’s always advisable to conduct thorough market analysis and consider other factors before making trading decisions.
In conclusion, ROC is a useful indicator for measuring price momentum in trading. By calculating the percentage change in price over a specified period, traders can identify trends and potential buying/selling opportunities. However, it should be used in conjunction with other tools and factors to make informed trading decisions.
Rate of Change (ROC), also known as Momentum, is a technical indicator that measures the percentage change in price over a specific period of time. It is used by traders to identify the strength and direction of price movements in a given market.
Read Also: What is 3S screener? - All You Need to Know about 3S Screener
ROC is calculated by dividing the current price by the price a certain number of periods ago, and then multiplying the result by 100 to get the percentage change. The number of periods used in the calculation can vary depending on the trader’s preference and the time frame being analyzed.
A positive ROC indicates that prices are increasing, while a negative ROC indicates that prices are decreasing. Traders may interpret ROC values above zero as a bullish signal, indicating that price momentum is positive and likely to continue. Conversely, ROC values below zero may be interpreted as bearish signals, suggesting that price momentum is negative and likely to continue in that direction.
ROC can be used in conjunction with other technical indicators and chart patterns to confirm trade signals and enhance trading strategies. It is important for traders to understand that ROC is a lagging indicator, meaning that it may not accurately predict future price movements.
Disclaimer: Trading involves risk and may not be suitable for all investors. It is important to carefully consider your objectives, level of experience, and risk tolerance before making any investment decisions. Past performance is not indicative of future results.
Read Also: Understanding Lot Size Money Management in Forex Trading
Rate of Change (ROC) is a technical indicator that can provide valuable insights and benefits to traders in the financial markets. Here are some of the key benefits of using ROC in trading:
1. Trend Identification: ROC can help traders identify the strength and direction of a trend. By measuring the rate at which prices are changing, ROC can indicate whether a trend is gaining or losing momentum. This information can be used to make more informed trading decisions.
2. Overbought and Oversold Conditions: ROC can also help traders identify potential overbought and oversold conditions in the market. When ROC reaches extreme levels, it can signal that a security is overvalued or undervalued, potentially indicating a reversal in price direction.
3. Confirmation of Price Movements: ROC can act as a confirmation tool for price movements. When the ROC aligns with the direction of the price trend, it can provide additional evidence that the trend is likely to continue. Traders can use this confirmation to increase their confidence in their trading decisions.
4. Divergence Detection: ROC can be used to detect divergences between the price and the indicator. Divergences occur when the price makes a higher high or a lower low, but the ROC fails to confirm the move. This can indicate a potential reversal in price direction and can be used as a signal to enter or exit trades.

5. Entry and Exit Points: By combining the use of ROC with other technical indicators and chart patterns, traders can identify potential entry and exit points with greater precision. This can help improve the timing of trades and increase the likelihood of profitability.
Overall, using ROC in trading can provide traders with valuable insights into market trends, overbought/oversold conditions, and price movements. By incorporating ROC into their trading strategy, traders can make more informed and profitable decisions.
ROC stands for Rate of Change, which is a technical analysis indicator that measures the percentage change between the current price and a past price. It helps traders identify the strength and direction of a trend in a security.
ROC is calculated by taking the current price and dividing it by the price at a certain time period ago. The result is then multiplied by 100 to get the percentage change. The formula is: (Current Price - Price n periods ago) / Price n periods ago * 100.
Traders can use ROC to determine if a security is overbought or oversold. If the ROC is in positive territory, it indicates that the security is gaining momentum and might be a good time to buy. Conversely, if the ROC is in negative territory, it suggests that the security is losing momentum and might be a good time to sell.
Yes, there are some limitations to using ROC. One limitation is that ROC is a lagging indicator, meaning it is based on past price data and may not accurately predict future price movements. It is also important to use ROC in conjunction with other technical analysis tools to confirm trading signals and avoid false signals.

Best Indicator Showing Buying and Selling Pressure When it comes to trading in the stock market, understanding buying and selling pressure is crucial. …
Read Article
Problems Associated with Moving Average The moving average is a commonly used statistical technique for analyzing time series data. It is widely used …
Read Article
Impact of Non-Farm Payrolls on the US Dollar The Non-Farm Payrolls (NFP) data, released monthly by the U.S. Department of Labor, is one of the most …
Read Article
Travelex vs Wise: Which One Is Better? When it comes to sending money abroad or exchanging currencies, there are various options to choose from. Two …
Read Article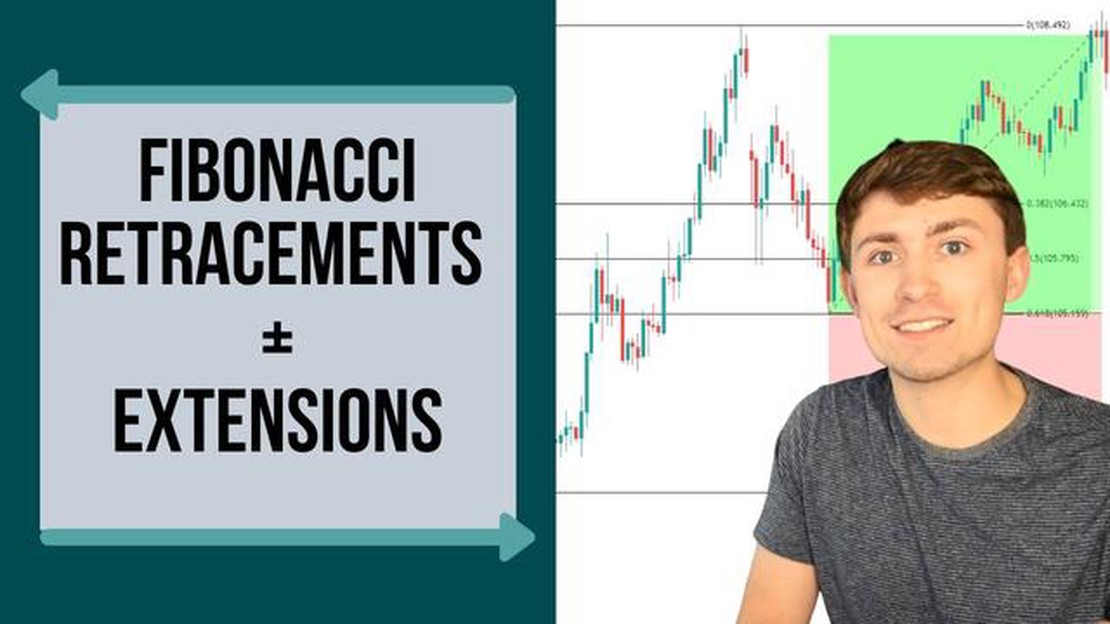
How to Use Fibonacci Extension in Forex Trading If you are a beginner in the world of Forex trading, you may have heard about Fibonacci extension. But …
Read Article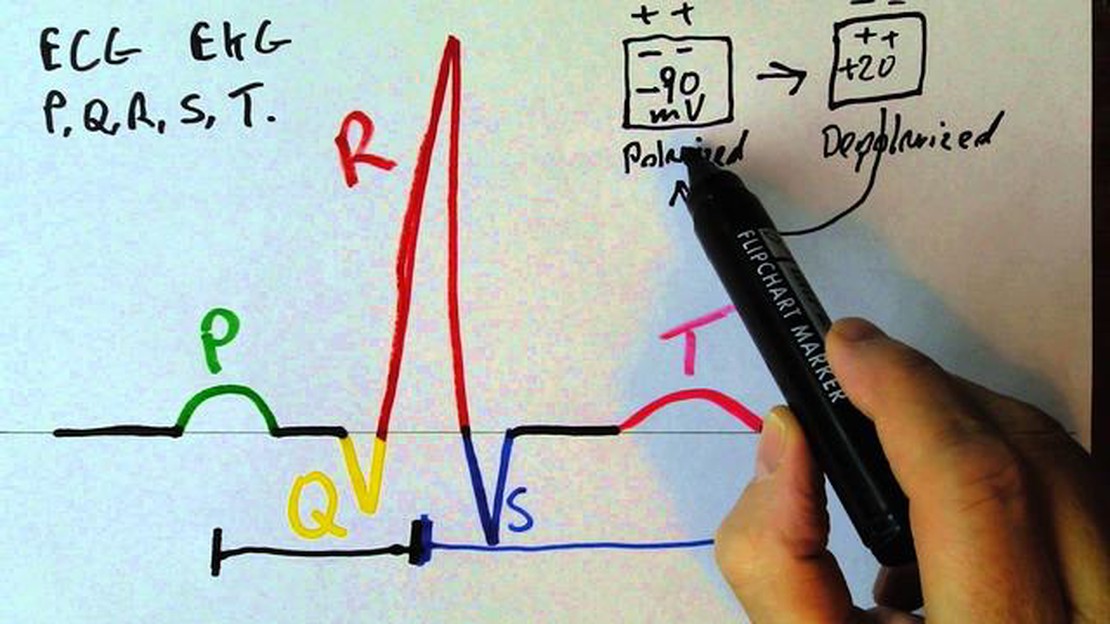
Understanding the Meaning of a Notched T Wave in EKG Readings An electrocardiogram (ECG) is a valuable diagnostic tool used to assess the electrical …
Read Article


