

Best Times to Trade Forex GMT: Maximizing Profitability through Strategic Timing
What are the best times to trade Forex GMT? In the world of forex trading, timing is everything. The value of currencies fluctuates constantly, and …
Read Article
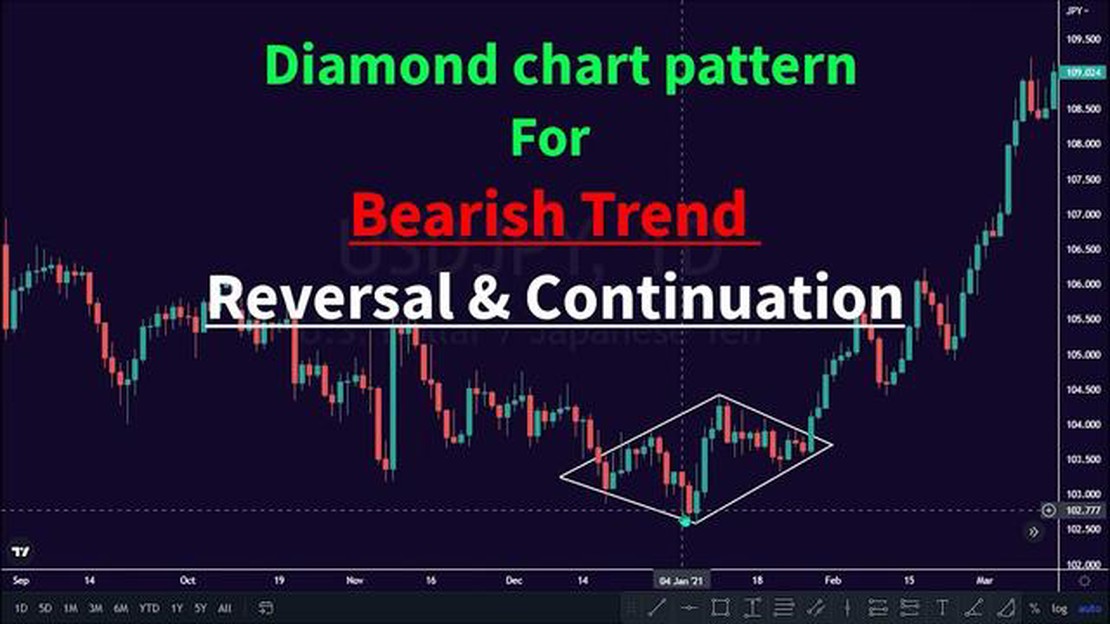
Diamond chart patterns are one of the most intriguing formations in technical analysis. As the name suggests, this pattern resembles a diamond and is often regarded as a reversal pattern. Traders and investors study these patterns to identify potential trend reversals and make informed decisions.
A diamond pattern typically forms after a prolonged uptrend or downtrend, indicating a period of consolidation or indecision in the market. It is characterized by two converging trendlines that form the shape of a diamond. The upper trendline connects a series of lower highs, while the lower trendline connects a series of higher lows.
This pattern is considered significant because it signifies a battle between buyers and sellers. As the price consolidates within the diamond formation, it indicates that the market participants are unsure about the future direction of the price. This uncertainty often leads to a period of indecisiveness and ultimately results in a breakout in one direction or the other.
The diamond pattern is a common technical analysis charting pattern used in financial markets. It is formed by converging trend lines that create a shape resembling a diamond. Traders often look for these patterns as they can provide insights into potential price reversals.
However, it is important to note that not all diamond patterns indicate a reversal. The interpretation of a diamond pattern depends on its context and the preceding price action.
In general, a diamond pattern can be considered a reversal pattern when it occurs after a prolonged trend. If the diamond pattern forms at the top of an uptrend, it may suggest that the trend is losing momentum and a reversal to a downtrend could be imminent. Conversely, if the diamond pattern forms at the bottom of a downtrend, it may indicate that selling pressure is weakening and a reversal to an uptrend could be looming.
Traders commonly use other indicators and confirmation signals to validate the diamond pattern as a reversal. These can include trend line breaks, volume analysis, and other chart patterns. It is important to note that technical analysis is not foolproof, and other factors such as fundamental analysis and market sentiment should also be taken into consideration.
It’s worth mentioning that not all diamond patterns result in a reversal. Sometimes, a diamond pattern can act as a continuation pattern, indicating that the prevailing trend is likely to continue. In such cases, traders should be cautious and use additional analysis tools to confirm the pattern before making trading decisions.
In conclusion, while a diamond pattern can provide valuable insights into potential price reversals, it is essential to consider other factors and use additional confirmation signals before making trading decisions. Sound risk management practices should always be followed to mitigate potential losses.
The diamond chart pattern is a technical analysis pattern that can indicate a potential reversal in the market. It is formed when the price of an asset creates a series of higher highs and lower lows, forming two converging trendlines that resemble a diamond shape.

The diamond pattern is considered a reversal pattern because it often occurs at the end of an uptrend or downtrend, signaling a potential reversal in the market direction. The pattern suggests that the market is losing momentum and is likely to reverse its current trend.
Traders and investors use the diamond pattern to identify potential reversal opportunities. When the price breaks out of the pattern, it can confirm the reversal and provide a trading signal. A breakout above the upper trendline indicates a bullish reversal, while a breakout below the lower trendline suggests a bearish reversal.
Read Also: How frequently do forex traders make trades?
It is important to note that not all diamond patterns result in a reversal. Sometimes, the price may break out of the pattern and continue in its previous trend. Therefore, it is crucial to wait for a confirmed breakout and consider other technical indicators or market conditions before making a trading decision.
When trading diamond patterns, risk management is essential. Traders should set stop-loss orders to limit potential losses if the price moves against their anticipated direction. Additionally, it is recommended to use other technical analysis tools, such as volume indicators or support and resistance levels, to enhance the accuracy of the trading signals.
In conclusion, understanding diamond chart patterns and their reversal potential can be a valuable tool for traders and investors. By recognizing the formation of a diamond pattern and waiting for a confirmed breakout, market participants can take advantage of potential trend reversals and make informed trading decisions.
Diamond chart patterns are technical formations that typically occur during periods of market consolidation. These patterns are characterized by their distinctive diamond shape, which is formed by two converging trendlines. One trendline connects a series of higher highs, while the other connects a series of lower lows.
The formation of a diamond chart pattern indicates a temporary balance between buyers and sellers in the market. This balance is reflected in the narrowing price range and decreasing trading volume that typically accompanies the pattern’s formation.
During the formation of a diamond chart pattern, price action alternates between making higher highs and lower lows within the confines of the trendlines. This back-and-forth movement creates a series of peaks and troughs that resemble a diamond shape when connected.
Read Also: Understanding the Role of the 20 EMA Indicator in the Share Market
Traders often interpret a diamond chart pattern as a potential reversal signal. The pattern suggests that the previous trend may be nearing its end and that a new trend may be forming. This potential reversal is indicated by the convergence of the trendlines, which suggests a weakening of the previous trend’s momentum.
However, it’s important to note that not all diamond chart patterns result in a reversal. Sometimes, the pattern may lead to a continuation of the previous trend. In such cases, the pattern acts as a brief pause or consolidation before the trend resumes.

When analyzing diamond chart patterns, traders often look for confirming signals to validate their interpretation of the pattern. These signals can include price breakouts above or below the pattern’s trendlines, bursts in trading volume, or the presence of other technical indicators that support the reversal or continuation thesis.
In conclusion, diamond chart patterns provide valuable insights into the formation and potential reversal of market trends. By understanding the dynamics of these patterns and combining them with other technical analysis tools, traders can make more informed trading decisions.
A Diamond chart pattern is a technical analysis pattern that forms on a price chart and is considered a reversal pattern. It is formed by two converging trendlines that resemble the shape of a diamond. This pattern indicates that the current trend is about to reverse.
A Diamond pattern reveals a potential reversal by showing a period of consolidation and indecision in the market. The price initially moves in a trend, but then starts to move within a narrower range, forming the diamond shape. This signifies a lack of clear direction and suggests that the buyers and sellers are evenly matched. Eventually, the price breaks out of the pattern in the opposite direction, indicating a reversal.
Yes, a Diamond pattern can be found on any type of chart, including stock charts, Forex charts, and commodity charts. It is a universal pattern that can be observed across different financial markets.
Diamond patterns, like any other technical analysis patterns, are not 100% reliable. While they can provide valuable insights into potential reversals, they should not be used as the sole basis for making trading decisions. It is important to consider other technical indicators, market conditions, and fundamental analysis before making any trading decisions.
Yes, Diamond patterns can be used for short-term trading. Traders can look for the breakouts from the pattern and position themselves accordingly to take advantage of the potential reversal. However, it is important to closely monitor the market and use proper risk management techniques, as trading short-term patterns can be highly volatile and risky.
A diamond pattern in trading is a technical chart pattern that forms when there is a period of consolidation and indecision in the market. It is characterized by a series of higher highs and lower lows, forming the shape of a diamond. This pattern is often considered a sign of a potential trend reversal.
To identify a diamond pattern on a chart, you need to look for a series of higher highs and lower lows that form a diamond shape. The upper trendline connects the higher highs, while the lower trendline connects the lower lows. The pattern is confirmed when the price breaks out of the diamond shape, either to the upside or downside.

What are the best times to trade Forex GMT? In the world of forex trading, timing is everything. The value of currencies fluctuates constantly, and …
Read Article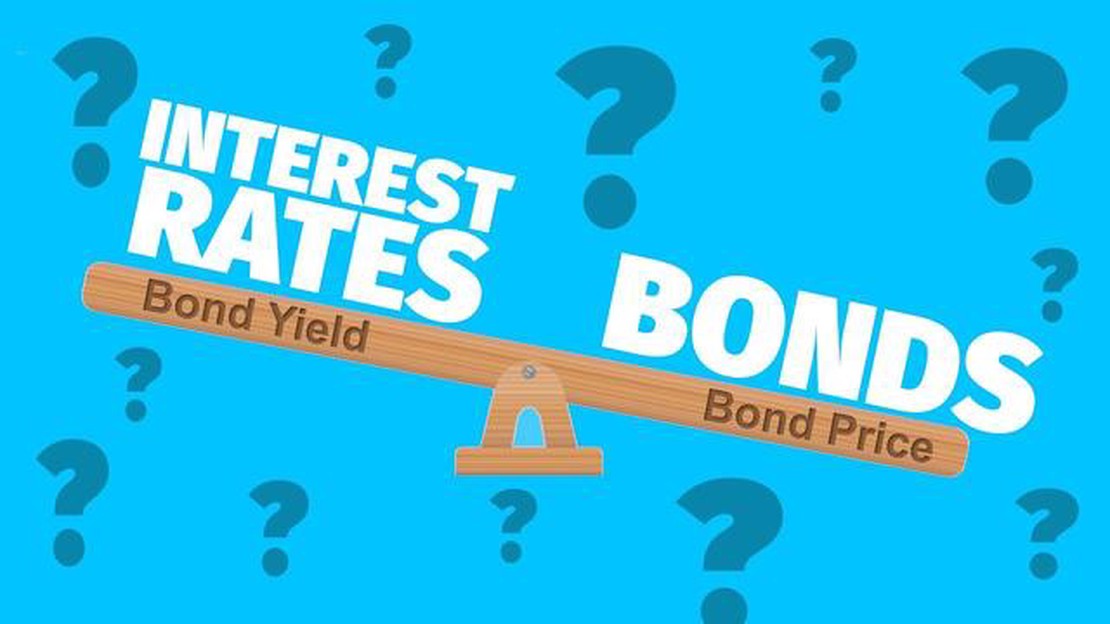
Does it make sense to invest in bonds during periods of high interest rates? Investing in bonds can be a smart move to diversify your portfolio and …
Read Article
Can NRI purchase foreign exchange in India? Foreign exchange, also known as forex, plays a crucial role in international trade and investment. It …
Read Article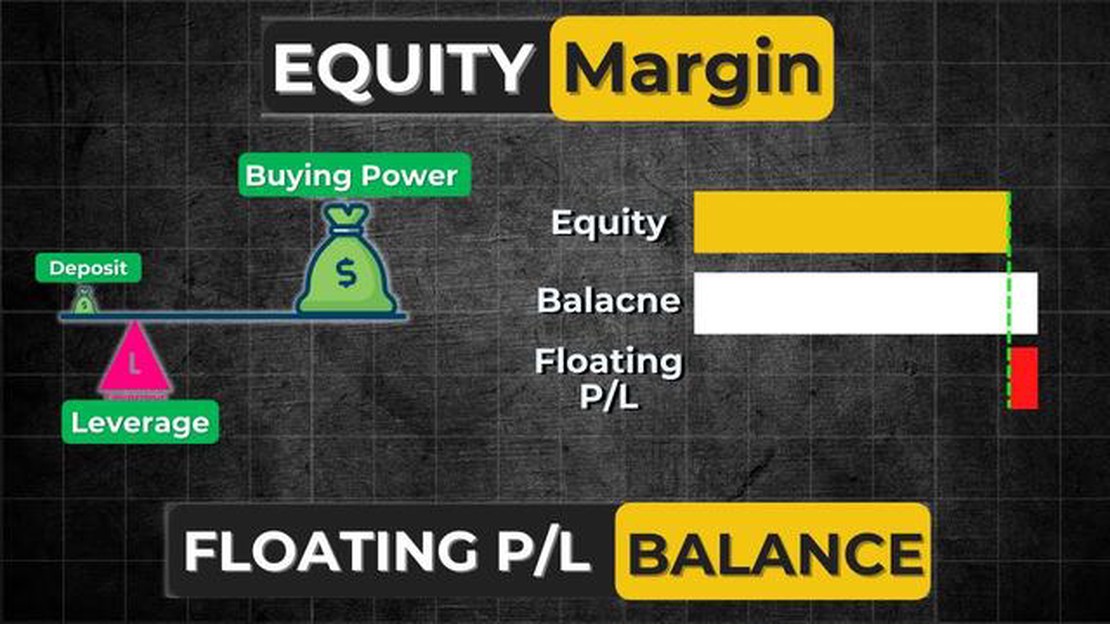
Understanding Floating P and L in Trading When it comes to finance and accounting, understanding the concept of floating P and L (profit and loss) is …
Read Article
What is the ideal time frame for trading? When it comes to trading, one of the most important decisions you will have to make is choosing the right …
Read Article
Should you buy, sell, or hold PepsiCo stock? With its wide range of popular beverage and snack brands, PepsiCo has long been a staple in the consumer …
Read Article


