

Understanding Forex Disclaimers: Real-life Examples and Importance
An Example of a Disclaimer in Forex Forex trading is a complex and volatile market that involves the buying and selling of currencies. Due to its high …
Read Article
Forex trends are a crucial aspect of successful trading. Being able to identify and understand these trends can help traders make informed decisions and take advantage of profitable opportunities in the foreign exchange market. However, spotting changing trends can be challenging, as the forex market is highly volatile and constantly evolving.
Fortunately, there are several key indicators that traders can watch to identify changing forex trends. These indicators can provide valuable insights into market conditions and help traders anticipate potential shifts in direction. By paying close attention to these indicators, traders can position themselves to take advantage of market movements and increase their chances of success.
One key indicator to watch is moving averages. Moving averages smooth out price data over a specified period and help traders identify the average price over a given time frame. By comparing different moving averages, traders can spot potential trend reversals or confirm ongoing trends. For example, a crossover of a short-term moving average above a long-term moving average can signal a potential uptrend, while a crossover in the opposite direction may indicate a potential downtrend.
Another important indicator is the Relative Strength Index (RSI). The RSI is a momentum oscillator that measures the speed and change of price movements. It ranges from 0 to 100 and is often used to identify overbought or oversold conditions in the market. When the RSI is above 70, it suggests that the market is overbought and a reversal may be imminent. Conversely, when the RSI is below 30, it indicates oversold conditions and a potential rebound in prices.
Additionally, traders should pay attention to support and resistance levels. These levels are areas on a price chart where the buying or selling pressure is significant enough to reverse or pause the current trend. By identifying these levels, traders can anticipate potential trend changes and adjust their trading strategies accordingly. Support levels act as a floor for prices, while resistance levels act as a ceiling. When a support level is broken, it may become a resistance level, and when a resistance level is broken, it may become a support level.
In conclusion, identifying changing forex trends is crucial for successful trading. By monitoring key indicators such as moving averages, the RSI, and support and resistance levels, traders can gain valuable insights into market conditions and make informed trading decisions. It is important to remember that no single indicator is foolproof, and traders should use a combination of indicators and tools to analyze trends and confirm signals. With practice and experience, traders can become adept at identifying changing trends and increase their chances of success in the forex market.

Identifying changing forex trends is crucial for successful trading in the forex market. By understanding the direction in which the market is moving, traders can make informed decisions and take advantage of opportunities to profit.
Read Also: How to Use the Momentum Meter Indicator in MT4
Here are some key indicators to watch when trying to identify changing forex trends:
It’s important to note that no single indicator can accurately predict changing trends in the forex market. Traders should use a combination of indicators and analysis techniques to increase their chances of identifying and confirming changing trends. Additionally, it’s essential to constantly monitor the market and adjust trading strategies as needed.
By staying alert and having a strong understanding of these key indicators, traders can improve their ability to identify changing forex trends and make profitable trading decisions.
Forex trends refer to the general direction in which a currency pair’s exchange rate is moving over a period of time. Understanding these trends is crucial for successful trading in the foreign exchange market. By identifying and analyzing forex trends, traders can make informed decisions about when to buy or sell currencies.
Forex trends can be classified into three main types:
To identify forex trends, traders often use technical indicators such as moving averages, trendlines, and chart patterns. These indicators help to smooth out price fluctuations and provide visual representations of trend direction.
It is important to note that forex trends can change over time. Traders should regularly monitor the market and adjust their trading strategies accordingly. Key indicators to watch for potential trend changes include breakouts from support or resistance levels, changes in volume, and shifts in market sentiment.
In conclusion, understanding forex trends is essential for successful trading in the foreign exchange market. By recognizing uptrends, downtrends, and sideways trends, traders can make informed decisions about when to enter or exit trades. Utilizing technical indicators can help identify and confirm these trends, while staying alert to key indicators can help traders anticipate potential trend changes.
Read Also: Is PAMM Legit? Unmasking the Truth About PAMM Accounts
It is important to identify changing forex trends because it allows traders to make informed decisions and adapt their trading strategies accordingly. By identifying trends, traders can increase the likelihood of making profitable trades and avoid potential losses.

Some key indicators to watch for identifying changing forex trends include moving averages, trendlines, and technical indicators such as the relative strength index (RSI) and the moving average convergence divergence (MACD). These indicators can help traders identify the direction and strength of a trend.
Yes, fundamental analysis can be used to identify changing forex trends. By analyzing economic data, news events, and geopolitical factors, traders can gain insights into the market sentiment and anticipate potential shifts in trends. However, it is important to combine fundamental analysis with technical analysis to get a comprehensive view of the market.
Yes, besides technical and fundamental analysis, traders should also consider market sentiment and overall market conditions. By monitoring the sentiment of other traders and market participants, traders can gauge the strength of a trend and determine if there is a possibility of a reversal. Additionally, being aware of market conditions such as volatility levels and trading volumes can provide further insights into changing trends.
The frequency of monitoring the forex market for changing trends depends on the trading style and preferences of the trader. Some traders prefer to monitor the market on a daily basis, while others may monitor it on a weekly or even monthly basis. It is recommended to find a balance and regularly review the market to stay updated on any changing trends that may affect trading decisions.

An Example of a Disclaimer in Forex Forex trading is a complex and volatile market that involves the buying and selling of currencies. Due to its high …
Read Article
Understanding the Forex Position: A Comprehensive Guide Foreign exchange, or forex, is a global market where currencies are bought and sold. It is the …
Read Article
Is Trading Binary Options Easy? Trading binary options is often portrayed as an easy and quick way to make money. With just a few clicks, you can …
Read Article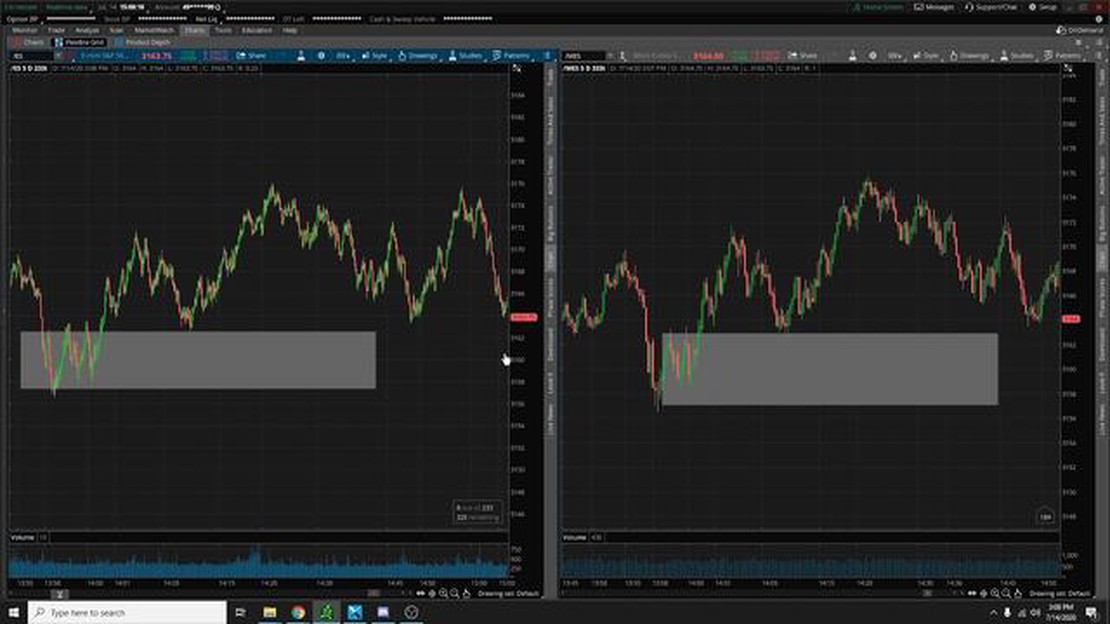
TD Ameritrade Futures: How Much Money Do I Need to Start Trading? TD Ameritrade, one of the leading brokerage firms in the United States, offers …
Read Article
Beginner’s Guide to Learning Options Strategy Options trading can be an exciting and potentially lucrative investment strategy, but it can also be …
Read Article
Have the Edmonton Oilers Made Any Trades? The Edmonton Oilers have been making waves in the NHL with their recent trades. Fans and analysts are …
Read Article


