

Understanding the Long Combo Option Strategy: A Comprehensive Guide
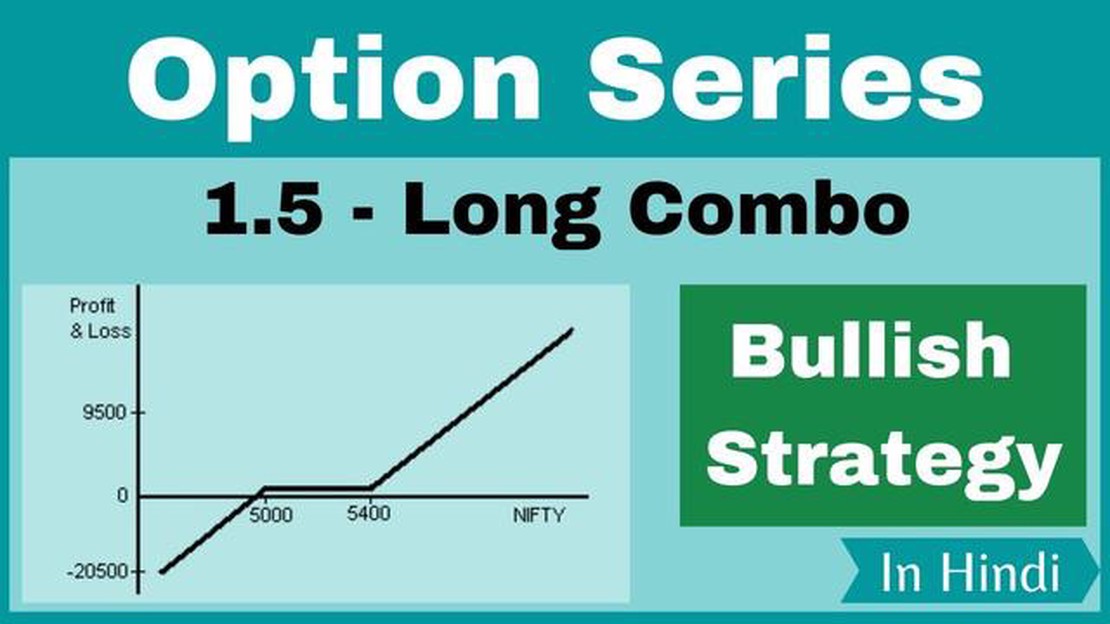
Long Combo Option Strategy Explained Options trading can be a complex and often risky endeavor, but for those willing to put in the time and effort to …
Read Article
When it comes to trading in the financial markets, there are various tools and indicators that can help traders make informed decisions. Two of the most commonly used indicators are Average Daily Range (ADR) and Average True Range (ATR). Both ADR and ATR provide valuable insights into market volatility and can assist traders in setting realistic profit targets and stop-loss levels.
The Average Daily Range (ADR) measures the average range between the high and low price of an asset over a specified period. Traders can use the ADR indicator to gauge the potential profit or loss they can expect within a given trading session. By understanding the average range of price movements, traders can set appropriate profit targets and determine when to exit a trade.
The Average True Range (ATR), on the other hand, measures the volatility of an asset’s price over a specified period. Unlike ADR, ATR takes into account any gaps or limit moves that occur between trading sessions. Traders can use the ATR indicator to assess the volatility and potential risk involved in a trade. A higher ATR value indicates higher volatility and potentially larger price movements, while a lower ATR value suggests lower volatility and smaller price ranges.
Note: Both ADR and ATR are calculated using historical price data, so they are lagging indicators. Traders should use them in conjunction with other technical analysis tools to confirm their trading decisions.
By incorporating ADR and ATR into their trading strategy, traders can effectively manage risk and increase their chances of trading success. Setting realistic profit targets based on ADR can prevent traders from holding onto losing trades for too long or exiting profitable trades prematurely. Traders can also use ATR to adjust their position size and risk management strategy based on market volatility.
It’s important to note that ADR and ATR are just tools and should not be used as standalone indicators. Traders should always analyze other aspects of the market, such as trend analysis, support and resistance levels, and volume, to make well-informed trading decisions. By combining these various indicators, traders can improve their trading results and increase their overall profitability.
ADR stands for Average Daily Range and ATR stands for Average True Range. Both ADR and ATR are popular tools used in technical analysis to measure volatility and set appropriate stop-loss and take-profit levels.

ADR calculates the average range between the daily high and low of an asset over a specified period. It provides traders with an estimation of how far an asset is likely to move on an average day. By knowing the ADR, traders can set realistic profit targets and adjust their position sizes accordingly.
ATR, on the other hand, takes into account gaps and price jumps during the specified period, providing a more accurate measurement of volatility. It helps traders to identify potential breakouts and determine the appropriate stop-loss levels to protect their positions.
Both ADR and ATR are typically represented as a number or a percentage. For example, an ADR of 100 pips means that the asset on average moves 100 pips per day. ATR may be expressed in absolute terms (e.g., 2.50) or as a percentage of the asset’s current price (e.g., 2.5% of the current price).
To calculate ADR, you need historical price data for the specified period. Simply take the average of the daily ranges over that period to get the ADR value.
Read Also: Can you copy trade on MT4? Here's everything you need to know
To calculate ATR, you need the true range for each day, which is the largest of the following: the current day’s high minus the current day’s low, the current day’s high minus the previous day’s close, or the current day’s low minus the previous day’s close. Then, you can calculate the ATR value by taking the average of the true ranges over the specified period.
Both ADR and ATR can be used in various trading strategies, such as breakout trading, trend following, and range trading. Traders can combine ADR and ATR with other technical indicators to make more informed trading decisions.
| ADR | ATR |
|---|---|
| Measures the average range between the daily high and low of an asset | Measures the average true range, taking into account gaps and price jumps |
| Helps traders set realistic profit targets and adjust position sizes | Helps traders identify potential breakouts and set appropriate stop-loss levels |
| Calculated as the average of the daily ranges over a specified period | Calculated as the average of the true ranges over a specified period |
| Can be used in breakout trading, trend following, and range trading | Can be combined with other indicators to make informed trading decisions |
In conclusion, understanding ADR and ATR is essential for traders looking to improve their trading results. By using these tools effectively, traders can better manage their risk and increase their chances of success.
Read Also: Weighted Moving Average vs. Exponential Smoothing: What are the key differences? Quizlet
ADR, or Average Daily Range, is a commonly used trading indicator that provides valuable information about the volatility and potential price movement of a financial instrument within a given period of time. It is calculated as the average price range between the high and low of each trading day over a specified period.
Traders use ADR to gain insights into the potential profit targets, stop loss levels, and overall risk management for their trades. By knowing the average price range of an instrument on a daily basis, traders can better assess the potential market movements and make informed decisions about when to enter or exit a trade.
Using ADR as a tool in trading can offer several benefits. Firstly, it helps traders set realistic profit targets and stop loss levels based on the average price range. This allows them to manage their risk effectively and avoid setting unrealistic expectations for their trades. Additionally, ADR can help traders identify potential market breakouts or reversals by comparing the current price range to the average range.
Moreover, ADR can be used in conjunction with other technical indicators such as ATR (Average True Range) to further enhance trading strategies. ATR measures the volatility of an instrument over a specified period and can provide additional insights into the potential price movement beyond the average range. By combining ADR and ATR, traders can obtain a more comprehensive understanding of the market conditions and adjust their trading strategies accordingly.

In conclusion, ADR is a valuable tool for traders as it provides crucial information about the average price range and volatility of a financial instrument. By utilizing ADR, traders can enhance their risk management, set realistic profit targets, and make more informed trading decisions. When used in conjunction with other indicators, such as ATR, ADR can further improve trading strategies and lead to better trading results.
ADR stands for Average Daily Range and ATR stands for Average True Range. Both are technical indicators used in trading to measure the volatility of a financial instrument. ADR calculates the average range between the high and low of a trading day over a certain period, while ATR calculates the average true range by factoring in gaps and limit moves. Traders use these indicators to set profit targets, determine stop-loss levels, and assess the potential risk/reward ratio of a trade.
Let’s say the ADR of a stock is 2% and its current price is at the upper end of the range. Based on this information, a trader might decide to take profits or tighten their stop loss as the stock reaches the ADR level, anticipating a potential reversal. ATR, on the other hand, can be used to set stop-loss levels by calculating a percentage of the average true range from the entry price.
Using ADR and ATR can provide traders with objective measurements of volatility, which can help them make more informed trading decisions. These indicators can also assist in setting realistic profit targets and determining appropriate stop-loss levels. By incorporating ADR and ATR into their trading strategies, traders can have a better understanding of the potential risks and rewards associated with a trade.
One limitation of using ADR and ATR is that they are based on historical price data, so they may not accurately predict future price movements. Additionally, these indicators do not take into account fundamental factors that can influence market volatility. Traders should use ADR and ATR in conjunction with other technical and fundamental analysis tools to get a more comprehensive view of the market.
Beginners can start by familiarizing themselves with how ADR and ATR are calculated and understand their significance in assessing volatility. They can then use these indicators to set profit targets and stop-loss levels based on their risk tolerance. It’s important for beginners to practice using ADR and ATR on demo accounts or with small positions before applying them to live trading. Additionally, beginners should continue to educate themselves on other technical analysis tools and strategies to enhance their trading skills.

Long Combo Option Strategy Explained Options trading can be a complex and often risky endeavor, but for those willing to put in the time and effort to …
Read Article
How to apply for a refund on HDFC forex card If you have recently used an HDFC forex card for your international travels, you may be wondering how to …
Read Article
Is Forex Trading Coming to an End? In recent months, there has been rising speculation about the potential closure of the forex trading market. As one …
Read Article
Today’s Euro to Dollar Exchange Rate Welcome to our daily update on the Euro to Dollar exchange rate! In this article, we will provide you with the …
Read Article
Trade Volume Indicator: How to Measure and Interpret It Trade volume is a crucial metric for investors and traders alike, as it provides insights into …
Read Article
How to Predict Simple Moving Averages Simple moving averages are widely used in technical analysis to identify trends and make predictions in the …
Read Article


