


What to do with stock options when they vest? A guide to maximizing your investment
Strategies for Dealing with Vesting Stock Options Stock options can be a valuable part of your investment portfolio, providing the opportunity to …
Read Article
In the world of data analysis and forecasting, moving average models are an indispensable tool. These models provide a simple yet effective way to predict future values based on past observations. In this article, we will explore the concept of moving averages, how to calculate them, and how they can be used to make accurate forecasts.
A moving average is a statistical technique that calculates the average of a subset of data points over a specific time period. The subset of data points, known as the window, slides or “moves” through the data set, and for each new window, a new average is calculated. This helps to smooth out any irregularities or fluctuations in the data and provides a clearer picture of the overall trend.
One of the most common types of moving averages is the simple moving average (SMA). It is calculated by taking the sum of all the data points in the window and dividing it by the number of data points. The resulting average is then plotted on a chart, creating a line that represents the trend in the data.
Another type of moving average is the exponential moving average (EMA). Unlike the SMA, the EMA gives more weight to recent data points, which makes it more responsive to changes in the data. This can be especially useful when forecasting in fast-paced or volatile environments.
Overall, moving average models are a powerful tool for forecasting and understanding trends in time series data. By calculating and analyzing moving averages, analysts and researchers can make informed predictions about future values and make data-driven decisions. So whether you’re analyzing stock prices, weather patterns, or customer behavior, incorporating moving average models into your analysis can greatly enhance your forecasting capabilities.
A moving average model, often abbreviated as MA model, is a simple and widely used forecasting method in time series analysis. It is based on the assumption that future values of a variable can be predicted by taking into account the average of past observations.
MA models are particularly useful when dealing with data that exhibits a trend or seasonality. By calculating the moving average of a series over a certain period, we can smooth out fluctuations and identify underlying patterns.
The basic idea behind an MA model is to estimate the current value of a variable based on a linear combination of its past values and a set of weights. These weights determine the importance of each past observation in the prediction. Typically, more recent observations are given higher weights, as they are considered to be more relevant.
The order of an MA model, denoted as MA(q), represents the number of past observations that are taken into account in the forecasting process. For example, an MA(3) model would consider the three most recent observations when calculating the moving average.
One of the main advantages of MA models is their simplicity and interpretability. They are relatively easy to understand and implement, making them a popular choice in practice. However, MA models have some limitations. They assume that the underlying process is stationary and do not take into account any long-term trends or external factors.
In summary, moving average models provide a straightforward approach to forecasting, particularly in situations where data exhibits a trend or seasonality. While they have their limitations, MA models can be a valuable tool in the forecasting toolkit.

Forecasting with moving average models offers several benefits in the field of data analysis and prediction. These models, which are based on the calculation of moving averages, allow for accurate predictions and trend identification, making them a valuable tool for businesses and researchers.
One of the main benefits of using moving average models for forecasting is their ability to smooth out random fluctuations in data. By taking an average of a specific number of data points, moving average models help to reduce noise and provide a clearer picture of the underlying trend. This can be particularly useful when analyzing time series data with seasonal fluctuations or irregular patterns.
Another advantage of using moving average models is their simplicity and ease of use. These models do not require complex calculations or extensive programming skills, making them accessible to a wide range of users. Additionally, moving average models can be easily adjusted and updated as new data becomes available, keeping the forecasts up to date and reliable.
Read Also: Discover the Highest Exchange Rate with the Indian Rupee
Furthermore, moving average models are versatile and can be applied to different types of data and situations. Whether forecasting sales, stock prices, or weather patterns, moving average models can provide valuable insights and predictions. Their flexibility and adaptability make them a valuable tool for decision making and planning.
In conclusion, forecasting with moving average models offers numerous benefits, including the ability to smooth out data, simplicity of use, and versatility. These models can provide accurate predictions and trend identification, making them valuable in various fields and industries. By incorporating moving average models into their forecasting processes, businesses and researchers can make more informed decisions and stay ahead in an ever-changing environment.
Moving average models have various practical applications in different fields. Here are some examples:
1. Finance: Moving average models are commonly used in the financial industry to predict stock prices and analyze market trends. Traders and investors use moving averages to identify potential buying or selling opportunities. By analyzing the moving average of a stock’s price over a specific time period, they can determine if a stock is in an upward or downward trend.
Read Also: When did Eurex start? History and Timeline of Eurex Exchange
2. Demand forecasting: Moving average models are used in demand forecasting to predict future demand for a particular product or service. By calculating the moving average of past demand data, companies can estimate future demand and adjust their production or inventory levels accordingly. This helps them optimize their supply chain and avoid stockouts or excess inventory.
3. Sales forecasting: Similar to demand forecasting, moving average models can be applied to sales data to forecast future sales. By analyzing the moving average of past sales, businesses can anticipate future sales trends and make informed decisions regarding pricing, marketing strategies, and resource allocation.
4. Time series analysis: Moving average models are widely used in time series analysis to smooth out irregularities or noise in data. By calculating the moving average, analysts can identify underlying trends and patterns, making it easier to identify seasonality, cyclical fluctuations, and other important factors affecting the data.

5. Quality control: Moving average models are used in quality control processes to monitor and detect changes in data over time. By comparing the moving average of a process or product’s measurements to predefined control limits, organizations can quickly identify any shifts or abnormalities, enabling them to take corrective actions and maintain quality standards.
6. Climate forecasting: Moving average models are utilized in climate forecasting to predict long-term temperature, rainfall, or other weather patterns. By analyzing historical climate data and calculating the moving average, meteorologists can make predictions about future climate conditions. These forecasts are crucial for agriculture, energy planning, and disaster preparedness.
Overall, moving average models are versatile tools that can be applied to a wide range of fields and industries. They provide valuable insights into data patterns and trends, making them an essential component of many forecasting and analytical processes.
A moving average model is a technique used in time series analysis to forecast future values by calculating the average of a specified number of past observations.
A moving average model forecasts future values by taking the average of a specified number of past observations. This helps in smoothing out random fluctuations and identifying trends in the data.
Using a moving average model has several advantages. It helps in identifying trends and patterns in the data, it smooths out random fluctuations, and it is simple and easy to understand.
While a moving average model is simple and easy to understand, it has certain limitations. It can be less accurate in predicting sudden changes or irregular patterns in the data. It also does not take into account the underlying factors that may be driving the data.
A moving average model can be used for various types of data, including economic data, financial data, and stock market data. However, it may not be suitable for all types of data and it is important to consider the characteristics of the data before applying a moving average model.
A Moving Average model is a statistical forecasting method that calculates the average of a series of values over time, with the average “moving” as new data becomes available.

Strategies for Dealing with Vesting Stock Options Stock options can be a valuable part of your investment portfolio, providing the opportunity to …
Read Article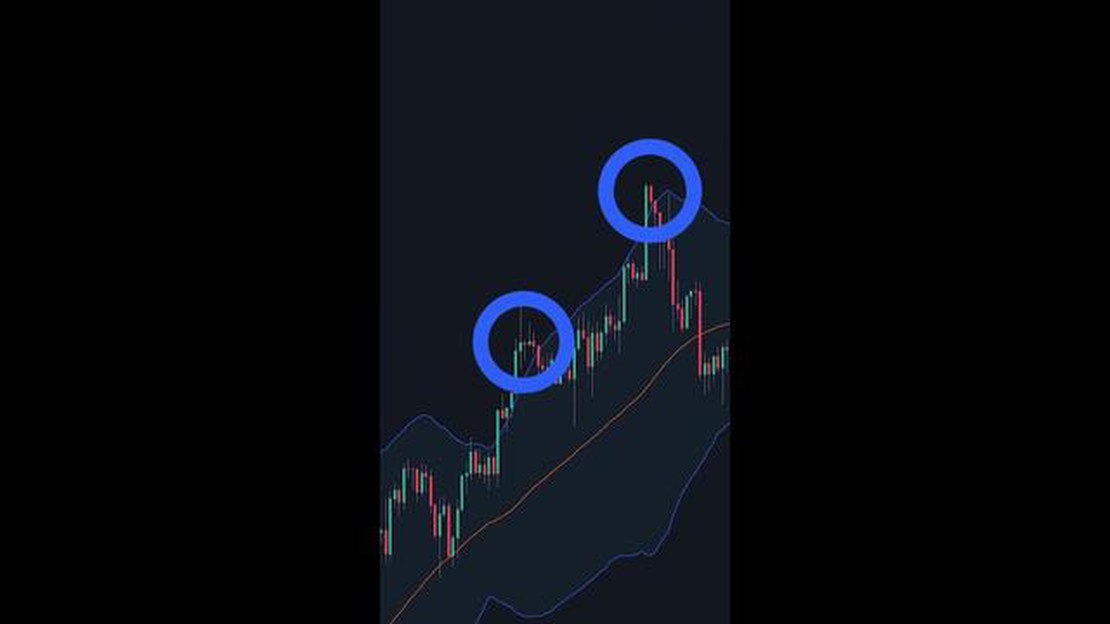
Is Bollinger worth the money? When it comes to Champagne, Bollinger is a name that is synonymous with luxury and elegance. The family-owned Champagne …
Read Article
What Happened on 9/11? September 11, 2001, is a date that will forever be etched in the collective memory of the world. On that fateful day, a series …
Read Article
Is Binary Halal or Haram? In today’s digital age, the use of binary code is ubiquitous. From computers to smartphones, binary code is the foundation …
Read Article
The Momentum Meter Indicator in MT4 - A Comprehensive Guide The Momentum Meter indicator is a powerful tool available on the MetaTrader 4 (MT4) …
Read Article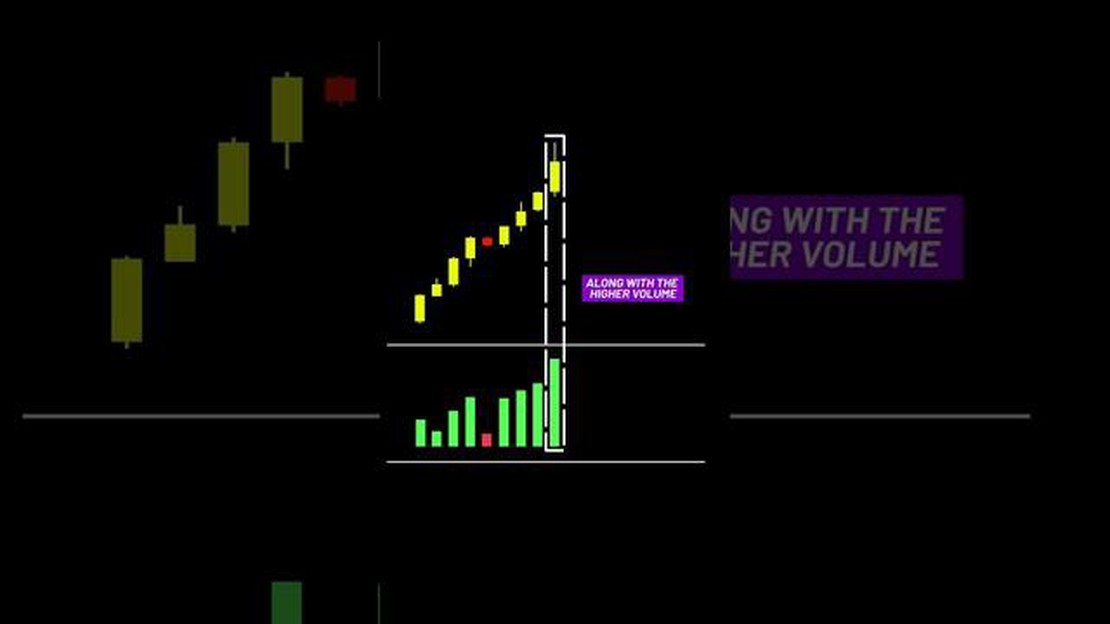
Understanding the Buying Climax in VSA Volume Spread Analysis (VSA) is a powerful tool used by traders to analyze the relationship between price, …
Read Article


