

Calculating the 3-Day Moving Average in SQL: Step-by-Step Guide
Calculating the 3 Days Moving Average in SQL When working with large datasets in SQL, it is often necessary to analyze trends and patterns over a …
Read Article
If you’re new to trading or investing, understanding technical analysis can be overwhelming. One commonly used tool is the moving average, which helps identify trends and potential entry or exit points. In this comprehensive guide, we will focus on the 3 period moving average and its basics.
A moving average is a calculation that smooths out historical price data over a given period. It helps traders identify the overall direction of a trend and filters out short-term fluctuations. The 3 period moving average is particularly useful for short-term analysis.
By averaging the closing prices of the last three periods, the 3 period moving average provides a clearer picture of the immediate trend. When the moving average is rising, it indicates an uptrend, while a declining moving average suggests a downtrend. Traders often use the crossover between the price and the moving average as a signal to enter or exit positions.
Example: Let’s say the closing prices of a stock for the last three periods are $10, $12, and $14. To calculate the 3 period moving average, add the three prices together and divide by 3. In this case, the moving average is $12.
Understanding the 3 period moving average can help traders make informed decisions and increase their chances of profiting from short-term trends. It’s important to note that no single indicator guarantees success, and it’s crucial to combine multiple tools and techniques when analyzing the market.

A moving average is a widely used statistical indicator that helps in analyzing trends over a certain period of time. It is often used in technical analysis to smooth out price data and identify the overall direction of a price trend.
The concept of moving averages involves calculating the average value of a set of data points over a specific time period. The data points can be any numerical values, such as the closing prices of a stock, the sales figures of a company, or the temperature readings of a city.
The main purpose of calculating moving averages is to remove the noise or random fluctuations present in the data and highlight the underlying trend. This is done by taking the average of a certain number of data points and updating the average as new data becomes available.
There are different types of moving averages, but the most commonly used ones are the simple moving average (SMA) and the exponential moving average (EMA). The SMA gives equal weight to all data points within the time period, while the EMA gives more weight to recent data points.
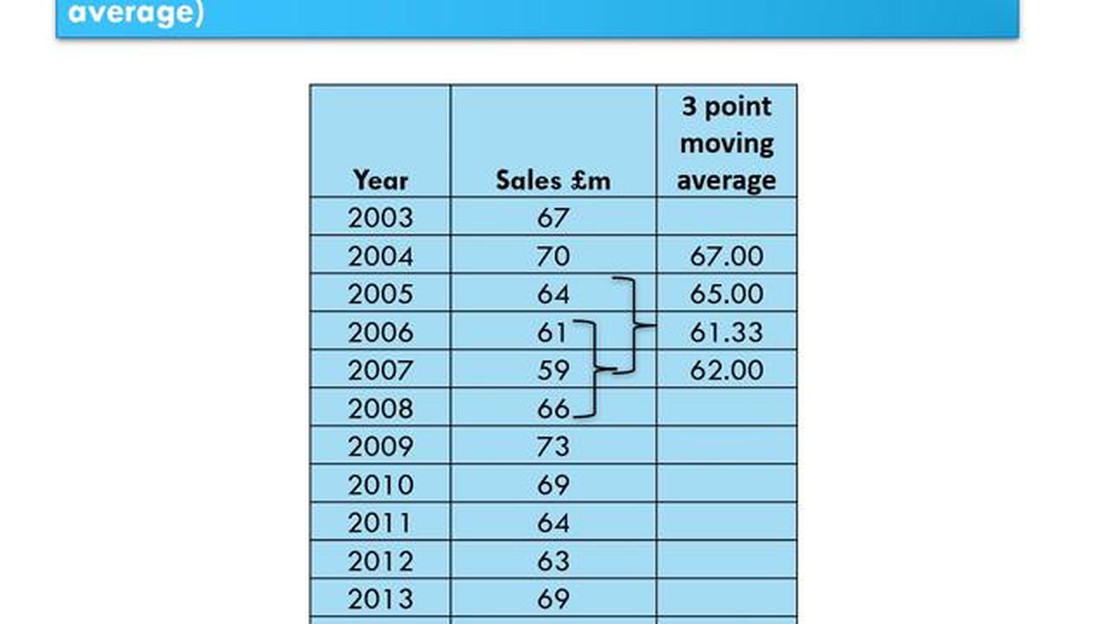
To calculate a moving average, you need to select a time period or the number of data points to be included in the average. For example, a 3-period moving average would calculate the average of the last 3 data points. The resulting value is then placed in the middle of the time period it represents.
Moving averages are often plotted on a chart to visualize the trend and identify potential buy or sell signals. When the price is above the moving average, it is considered a bullish signal, indicating an uptrend. Conversely, when the price is below the moving average, it is a bearish signal, indicating a downtrend.
Read Also: Why is the Swiss franc so strong: Understanding the factors behind its economic power
Overall, understanding the concept of moving averages is essential for any trader or investor looking to analyze market trends and make informed decisions. It is a valuable tool that can help in identifying potential entry or exit points in the market and improve trading strategies.
| Type | Calculation | Weighting |
|---|---|---|
| Simple Moving Average (SMA) | (Sum of data points) / (Number of data points) | Equal weighting |
| Exponential Moving Average (EMA) | (Price today * Smoothing factor) + (EMA yesterday * (1 - Smoothing factor)) | More weight to recent data points |
Read Also: Understanding Option Trading in the Forex Market: A Comprehensive Guide
There are different types of moving averages that traders and analysts use to understand price trends and make informed decisions. The three most commonly used types of moving averages are:
1. Simple Moving Average (SMA): This is the most basic form of moving average calculation. It is calculated by taking the sum of the closing prices over a given number of periods and dividing it by the number of periods. SMA reacts slower to recent price changes compared to other types of moving averages.
2. Exponential Moving Average (EMA): This moving average gives more weight to recent prices compared to older ones. EMA places more emphasis on the most recent data points, making it more responsive to price changes. It is calculated using a formula that incorporates a smoothing factor.
3. Weighted Moving Average (WMA): WMA assigns different weights to different data points, giving more importance to recent prices. It calculates the average by multiplying each data point with a predefined weight and summing them up. WMA is more sensitive to recent price changes compared to SMA.
Traders and analysts choose the type of moving average to use based on their trading strategy, timeframe, and preference for responsiveness to price changes. Each type has its own strengths and weaknesses, and it is important to understand how they work to make better trading decisions.
A moving average is a statistical calculation used to analyze data over a certain period of time. It smooths out fluctuations and helps identify trends within the data.

The 3-period moving average is commonly used because it provides a good balance between smoothing out fluctuations and capturing short-term trends. It is simple and easy to calculate, making it a popular choice for many traders and analysts.
To calculate the 3-period moving average, you add up the closing prices of the last 3 periods and then divide the sum by 3. This gives you the average of the last 3 periods. As each new period’s data becomes available, you remove the oldest period’s data and add the newest period’s data to calculate the new moving average.
Using a moving average can help identify trends, determine support and resistance levels, and generate buy or sell signals. It can also help filter out noise and smooth out fluctuations in the data, making it easier to interpret and analyze.
While moving averages can be a useful tool, they are not infallible. They can lag behind current market conditions, especially during periods of high volatility. They can also generate false signals or whipsaws when the market is choppy or range-bound. It’s important to use moving averages in conjunction with other technical indicators and analysis tools to get a more comprehensive picture of the market.

Calculating the 3 Days Moving Average in SQL When working with large datasets in SQL, it is often necessary to analyze trends and patterns over a …
Read Article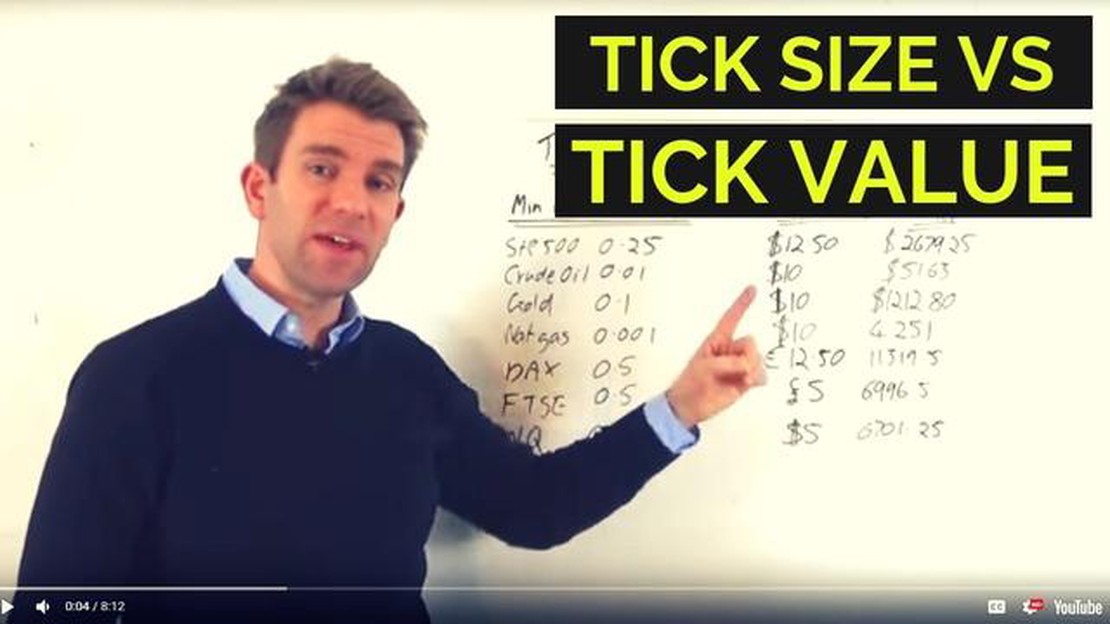
Understanding the Tick Size in Forex Trading When it comes to trading in the foreign exchange market, understanding the tick size is crucial. The tick …
Read Article
Are US Options Traded After Hours? Options trading is a popular investment strategy that allows traders to speculate on the price movement of a stock …
Read Article
Is Ma and MACD the same? Traders and investors often use technical indicators to analyze financial markets and make informed decisions about when to …
Read Article
Discover the Creators of Forex: A Fascinating History Unveiled The Foreign Exchange market, popularly known as Forex, is the largest and most liquid …
Read Article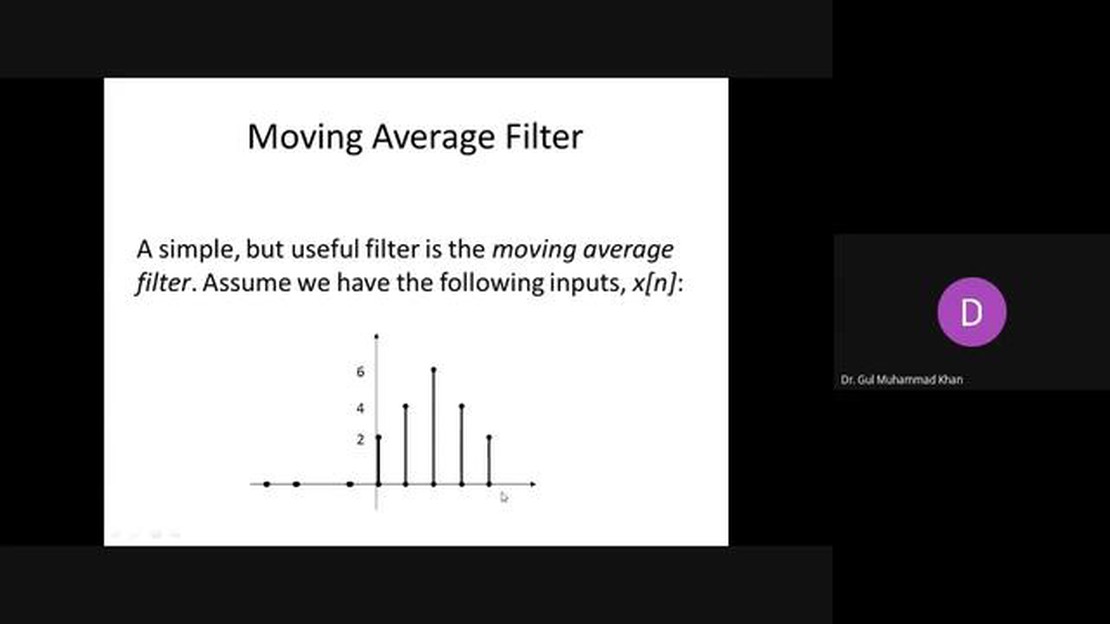
Impulse response of the moving average system When it comes to analyzing and understanding signals in various fields, the impulse response of a system …
Read Article


