


Understanding the Meaning of a Descending Triangle in Forex Trading
Understanding the Meaning of a Descending Triangle in Forex Trading When it comes to forex trading, understanding different chart patterns is crucial …
Read Article

Traders and investors often use technical indicators to analyze financial markets and make informed decisions about when to enter or exit a trade. Moving Average (MA) and Moving Average Convergence Divergence (MACD) are two commonly used indicators that provide valuable insights into market trends and help identify potential buying or selling opportunities.
While both indicators are based on moving averages, they have distinct differences in terms of calculation methods, interpretation, and applications. Understanding these differences is crucial for traders who want to utilize these indicators effectively and maximize their trading success.
A Moving Average (MA) is a simple yet powerful indicator that helps smooth out price fluctuations and identify the overall direction of a market. It calculates the average price of a security over a specific period, typically using the closing prices. Traders often use different time periods to calculate MAs, such as 20-day MA or 50-day MA, to analyze short-term or long-term trends, respectively.
On the other hand, Moving Average Convergence Divergence (MACD) is a more complex indicator that combines multiple moving averages to provide a deeper analysis of market momentum and trend reversals. MACD consists of two lines - the MACD line and the Signal line - as well as a histogram. The MACD line is calculated by subtracting the 26-day exponential moving average (EMA) from the 12-day EMA, while the Signal line is a 9-day EMA of the MACD line. The histogram represents the difference between the MACD line and the Signal line, indicating the strength or weakness of the trend.
In summary, MA and MACD are both useful indicators for analyzing market trends, but they differ in terms of calculation methods and the level of information they provide. MAs are simpler and provide a smoother overview of market direction, while MACD offers a more detailed analysis of market momentum and trend reversals. Traders should consider their trading strategies and objectives when choosing between MA and MACD or utilizing them together to gain deeper insights into the market.
No, Ma and MACD are not the same. While they both relate to technical analysis in the stock market, they have distinct differences in terms of their calculation and interpretation.
Ma stands for Moving Average, which is a commonly used indicator in technical analysis. It calculates the average price of a stock or security over a specified period of time, such as 10 days or 50 days. The Moving Average is used to identify trends and smooth out price fluctuations. Traders and investors use different types of moving averages, such as Simple Moving Average (SMA) and Exponential Moving Average (EMA), depending on their trading strategies and preferences.
MACD, on the other hand, stands for Moving Average Convergence Divergence. It is a trend-following momentum indicator that consists of two lines - the MACD line and the signal line. The MACD line is calculated by subtracting a longer-term moving average, typically the 26-day EMA, from a shorter-term moving average, usually the 12-day EMA. The signal line is a 9-day EMA of the MACD line. MACD is used to identify potential buy or sell signals when the MACD line crosses above or below the signal line.
While both Ma and MACD involve the use of moving averages, Ma is focused on calculating the average price over a specific period of time, while MACD is more concerned with the convergence and divergence of different moving averages. They serve different purposes in technical analysis and are used by traders and investors to make informed decisions in the stock market.
In conclusion, Ma and MACD are both useful tools in technical analysis, but they have distinct calculations and interpretations. Understanding their differences can help traders and investors better analyze and interpret stock market trends.

When it comes to technical analysis in trading, two commonly used indicators are Moving Averages (MA) and Moving Average Convergence Divergence (MACD). While they both provide information about trends, they have different calculations and purposes.
Moving Averages (MA):
A Moving Average (MA) is a trend-following indicator that smooths out price fluctuations and highlights the underlying trend. It is calculated by adding the closing prices over a specific period and dividing it by the number of periods.
MA can be categorized into different types, such as Simple Moving Average (SMA), Exponential Moving Average (EMA), and Weighted Moving Average (WMA). SMA gives equal weightage to all prices, while EMA and WMA give more weightage to recent prices.
Read Also: Understanding U and D in Binomial Option Pricing
Traders use MAs to identify support and resistance levels, determine trend direction, and generate trading signals. For example, a crossover of the short-term MA above the long-term MA can be a bullish signal, indicating a potential buying opportunity.
Moving Average Convergence Divergence (MACD):
The Moving Average Convergence Divergence (MACD) is a momentum indicator that shows the relationship between two Moving Averages of a security’s price. It consists of three components: MACD line, signal line, and histogram.
The MACD line is calculated by subtracting the longer-term MA from the shorter-term MA. The signal line, often a 9-day EMA of the MACD line, is used to generate trading signals when it crosses the MACD line. The histogram represents the difference between the MACD line and the signal line and helps visualize the momentum.
Read Also: Which is More Challenging: Futures Trading or Options Trading?
MACD is primarily used to identify potential buy or sell signals. For example, when the MACD line crosses above the signal line, it is considered a bullish signal, indicating a potential buying opportunity. Conversely, when the MACD line crosses below the signal line, it is considered a bearish signal, indicating a potential selling opportunity.
Main Differences:
While both MA and MACD are trend-following indicators, their calculations and purposes differ. MA focuses on smoothing out price fluctuations and identifying trend direction, whereas MACD focuses on momentum and generating trading signals.
MA is calculated by averaging closing prices over a specific period, while MACD is calculated by subtracting two Moving Averages and adding a signal line. Additionally, MA can be categorized into different types based on the weighting assigned to prices, while MACD has a fixed calculation.

Both MA and MACD are valuable tools for traders and can be used in conjunction with other technical indicators to make informed trading decisions. Understanding their differences and how they complement each other can enhance trading strategies and improve overall analysis.
In trading, MA stands for Moving Average. It is a technical indicator that is used to analyze the average price of a security over a specific period of time.
MACD stands for Moving Average Convergence Divergence. It is also a technical indicator that is used to identify potential buy and sell signals in trading. While both MA and MACD are based on moving averages, MACD incorporates the difference between two moving averages, which provides additional information about the trend and momentum of a security.
MA is calculated by taking the sum of closing prices over a specific period of time and dividing it by the number of periods. This provides an average price for that period, which helps to smooth out fluctuations and identify trends in the price of a security.
MA is commonly used to identify trends in the market. Traders often look for crossovers of different moving averages as potential buy or sell signals. However, it is important to note that MA is a lagging indicator and should be used in conjunction with other technical indicators and analysis.
One of the advantages of using MACD over MA is that it provides more information about the trend and momentum of a security. The MACD line is calculated by subtracting a longer-term moving average from a shorter-term moving average, and the MACD histogram shows the difference between the MACD line and a signal line. This additional information can help traders make more informed decisions.
No, MA (Moving Average) and MACD (Moving Average Convergence Divergence) are not the same. Both are technical indicators used in technical analysis, but they have different purposes and calculations.
The main difference between MA (Moving Average) and MACD (Moving Average Convergence Divergence) is their purpose. MA is used to identify and confirm trends, while MACD is used to identify potential reversals or trend changes. Additionally, MA calculates the average closing prices over a specified period, while MACD calculates the difference between two moving averages.

Understanding the Meaning of a Descending Triangle in Forex Trading When it comes to forex trading, understanding different chart patterns is crucial …
Read Article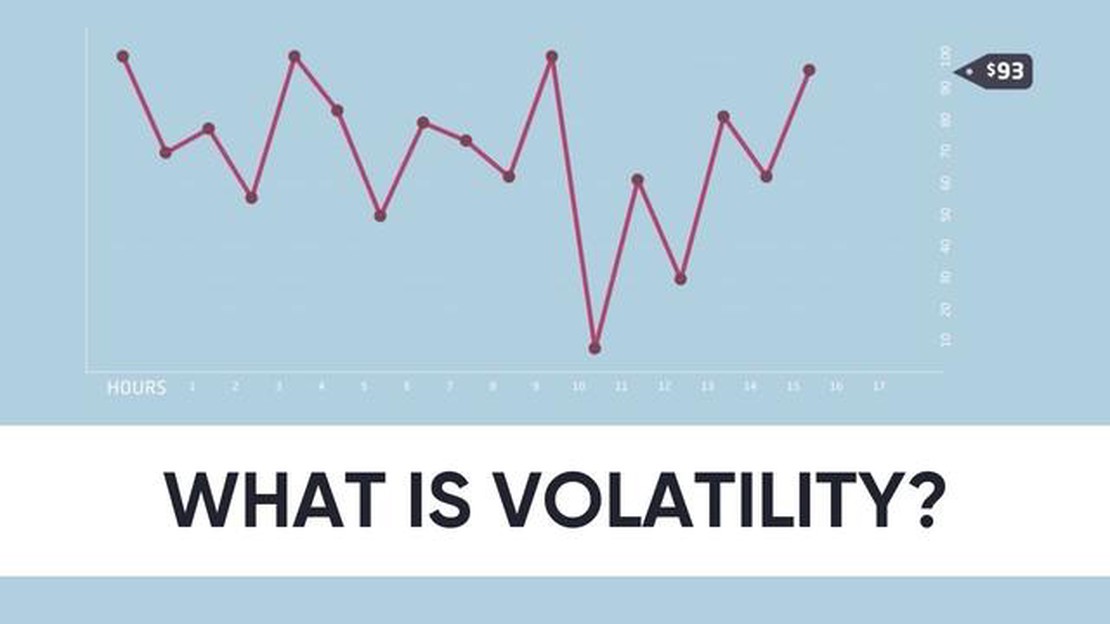
Understanding Volatility in Forex Trading Volatility is a key concept in the forex market, and understanding it is crucial for any trader looking to …
Read Article
How to Get Sponsored by a Sporst Company Getting sponsored by a sports company can be a dream come true for many athletes. It not only provides …
Read Article
Future of Fmcc As technology continues to advance at an unprecedented rate, it is no surprise that the future of FMCC (Facilities Management and …
Read Article
Current Pound Exchange Rate Today If you are interested in the latest exchange rate for the British Pound (GBP), you have come to the right place. In …
Read Article
Understanding Error 134 on MT4: Causes and Solutions Error 134 on MT4 is a common issue that many traders encounter while using MetaTrader 4, a …
Read Article


