


Choosing the Best Software for Investing in Stocks: A Comprehensive Guide
Best Software for Investing in Stocks Investing in stocks can be a daunting task, especially for beginners. With so many software options available on …
Read Article
Volume Spread Analysis (VSA) is a powerful tool used by traders to analyze the relationship between price, volume, and market activity. By understanding and interpreting the patterns and signals that VSA provides, traders can make informed decisions about the market direction and enter or exit trades at the right time.
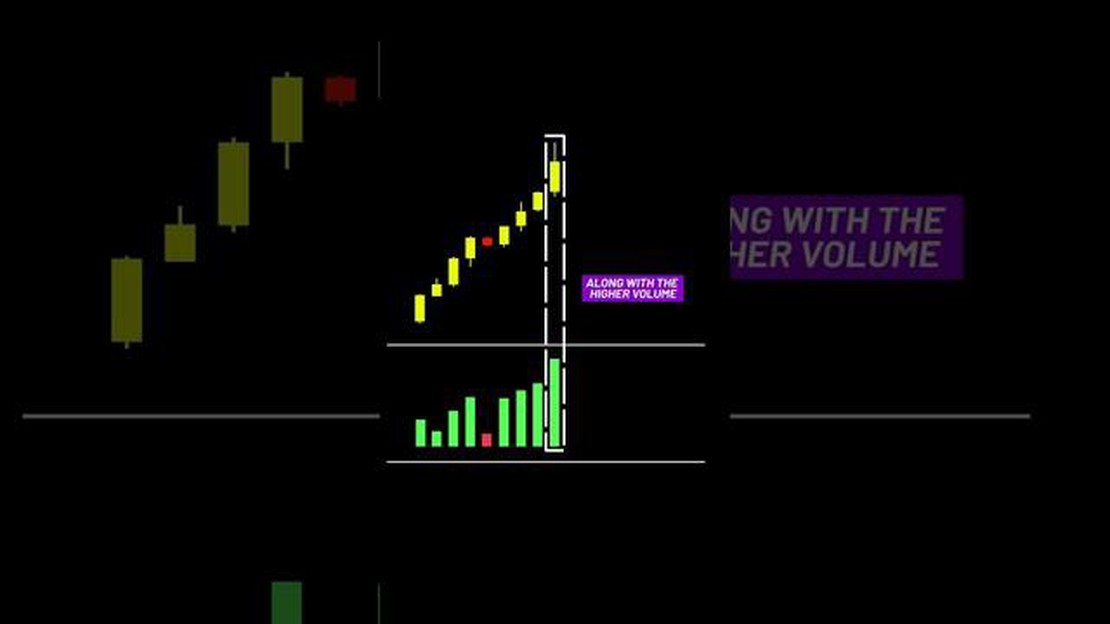
One of the key concepts in VSA is the Buying Climax. A Buying Climax occurs when there is a surge in buying volume, often accompanied by a sharp rise in price, followed by a reversal or a period of consolidation. This indicates that buying pressure has reached its peak and that the market is likely to turn in favor of sellers.
When a Buying Climax occurs, it suggests that smart money or institutional investors are distributing their shares to less informed retail traders or investors who are buying at the top of the market. This is a bearish signal, as it indicates that the market may be due for a correction or a downtrend.
To identify a Buying Climax, traders look for specific patterns in the price and volume chart. These patterns include a rapid increase in price with exceptionally high volume, followed by a price reversal or a period of consolidation. Additionally, traders also look for signs of exhaustion, such as a long upper wick or a doji candlestick.
Understanding and recognizing the Buying Climax in VSA can help traders to avoid entering trades at the top of the market, minimize losses, and increase their profitability. By leveraging the power of VSA, traders can gain a competitive edge in the market and improve their trading results.
In Volume Spread Analysis (VSA), a buying climax refers to a specific pattern that occurs in the financial markets. It is a term used to describe a situation where there is a significant increase in buying activity followed by a sharp decline in prices.

A buying climax is characterized by high volume and a wide price spread, indicating a strong buying pressure. This surge in buying activity is usually driven by optimistic market sentiment and high demand for a particular asset or security. As a result, prices typically rise rapidly.
However, after reaching a peak, the buying pressure subsides, creating a supply imbalance in the market. This imbalance leads to a dramatic reversal in prices, often accompanied by a decrease in volume. Traders and investors who bought the asset at the peak of the buying climax may start selling to take profits, further exacerbating the decline.
In VSA, a buying climax is considered a bearish signal, suggesting that the market is at risk of experiencing a significant downward correction or a trend reversal. It indicates that the buying pressure has exhausted itself and that the market sentiment has shifted from bullish to bearish.
Read Also: How does dividend affect earnings per share?
Traders and investors who are familiar with VSA use the buying climax as a valuable tool in their analysis to help identify potential market turning points. By recognizing the signs of a buying climax, they can make informed decisions about when to enter or exit positions, potentially mitigating losses or maximizing profits.
Overall, understanding the buying climax in Volume Spread Analysis is essential for traders and investors who utilize VSA as part of their trading strategy. It allows them to gauge market sentiment, anticipate market movements, and make more informed trading decisions.
Buying climax candlestick signals are important to understand for traders using Volume Spread Analysis (VSA) to analyze market trends. A buying climax occurs when there is a sudden spike in buying activity followed by a reversal in price.
When analyzing buying climax candlestick signals, traders look for several key characteristics:
Traders use buying climax candlestick signals to make trading decisions. For example, they may choose to sell their positions or enter short trades after identifying a buying climax, anticipating a potential price reversal. Additionally, they may look for confirmation from other VSA indicators, such as decreasing volume or weakening buying pressure.
It is important for traders to combine buying climax candlestick signals with other technical analysis tools to increase the accuracy of their trading decisions. By understanding and correctly interpreting these signals, traders can enhance their understanding of market dynamics and potentially improve their profitability.
When analyzing a buying climax in Volume Spread Analysis (VSA), it is important to examine both the volume and price action to understand the market sentiment. A buying climax occurs when there is a surge in buying activity, often accompanied by a rapid and significant increase in price.
Volume: In a buying climax, volume tends to be abnormally high compared to previous trading sessions. This indicates a high level of participation from buyers, suggesting a strong bullish sentiment. Traders and investors are usually rushing to buy, creating a buying frenzy that can lead to an exaggerated increase in price.
Read Also: Learn How to Study Forex Trends and Make Informed Trading Decisions
Price Action: The price action during a buying climax typically exhibits sharp upward movement, often forming a long and extended green (bullish) candlestick. This indicates that buyers are willing to pay higher prices as they compete to buy the asset. However, it is important to note that the market may be overbought and due for a correction or reversal in the near future.
Additionally, it is crucial to observe the presence of any signs of weakness or selling pressure during a buying climax. This can be identified through the presence of long upper wicks or shooting star candlestick patterns, indicating that sellers are entering the market and potentially signaling a potential reversal in the uptrend.
In conclusion, analyzing volume and price action during a buying climax can provide valuable insights into the overall market sentiment. Understanding the dynamics of buying and selling pressure can help traders make informed decisions and anticipate potential reversals or corrections in the market.

The buying climax in Volume Spread Analysis refers to a situation in the market where there is a sudden surge in buying activity, often accompanied by a significant increase in volume. It indicates that buyers have reached a state of euphoria and are willing to pay higher prices for the asset. However, it usually marks the top of the market and is followed by a reversal or a period of consolidation.
To identify a buying climax in Volume Spread Analysis, traders look for a sharp increase in buying activity accompanied by a large spike in volume. They also analyze the price action to see if the market reaches an extreme high, followed by a reversal or consolidation. Additionally, they pay attention to the spread between the high and low prices, as a narrow spread during a buying climax can indicate weakness in the market.
A buying climax typically indicates a potential reversal or a period of consolidation in the market. It suggests that buyers have become overly optimistic and are willing to pay higher prices, which often leads to a lack of buying interest and a subsequent decline in prices. Traders who recognize a buying climax can use this information to make informed trading decisions and potentially profit from the market’s reversal.
A buying climax, along with other Volume Spread Analysis principles, can provide insights into potential future market movements. While it doesn’t guarantee a specific outcome, it can help traders identify potential reversal points, areas of consolidation, or periods of weakness in the market. By combining the buying climax with other technical analysis tools, traders can make more informed decisions and increase their chances of success in the market.

Best Software for Investing in Stocks Investing in stocks can be a daunting task, especially for beginners. With so many software options available on …
Read Article
Understanding RSU Equity Awards RSU (Restricted Stock Units) equity awards are an increasingly popular form of compensation for employees in the …
Read Article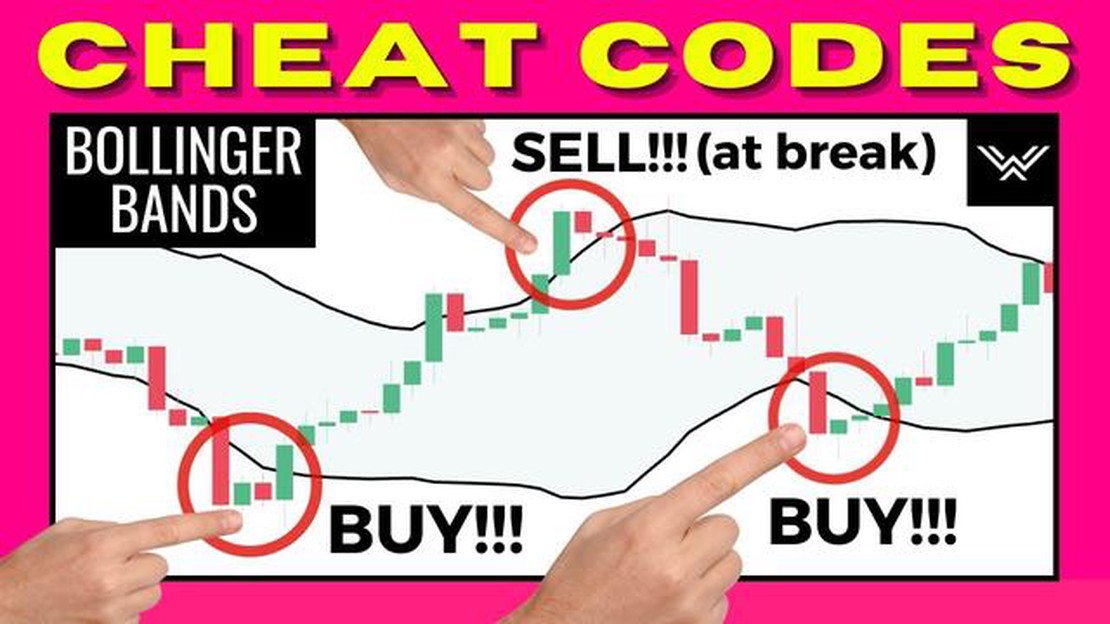
Step-by-Step Guide: How to View Bollinger Bands Bollinger Bands are a popular technical analysis tool used to analyze price volatility in financial …
Read Article
Python for Technical Analysis: A Comprehensive Guide Technical analysis is a method used by traders and investors to analyze and predict future price …
Read Article
Cost Basis of Exercised Stock Options: Understanding the Basics Exercising stock options can be an exciting experience, especially when it comes to …
Read Article
Is MCX Trading Legal in India? MCX trading, also known as Multi Commodity Exchange trading, is a popular form of investment in India. Investors can …
Read Article


