
Are Bull Put Spreads Profitable? | The Ultimate Guide
Are Bull Put Spreads Profitable? When it comes to options trading, bull put spreads are a popular strategy among investors. But are they profitable? …
Read Article
Bollinger Bands are a popular technical analysis tool used to analyze price volatility in financial markets. They consist of a simple moving average (SMA) in the middle, and an upper and lower band that are a certain number of standard deviations away from the SMA. Developed by John Bollinger in the 1980s, Bollinger Bands are widely used by traders and investors to identify potential entry and exit points in the market.
The middle band represents the average price over a specified period of time, typically 20 periods. The upper band is typically set two standard deviations above the SMA, while the lower band is set two standard deviations below the SMA. The width of the bands is determined by the volatility of the price. When the price is more volatile, the bands widen, and when the price is less volatile, the bands contract.
Traders use Bollinger Bands in several ways. One common strategy is to look for a squeeze, which occurs when the bands contract tightly around the price. This suggests that the market is experiencing low volatility and is due for a breakout. Traders will then look for a price movement outside of the bands, signaling a potential trend reversal or continuation.
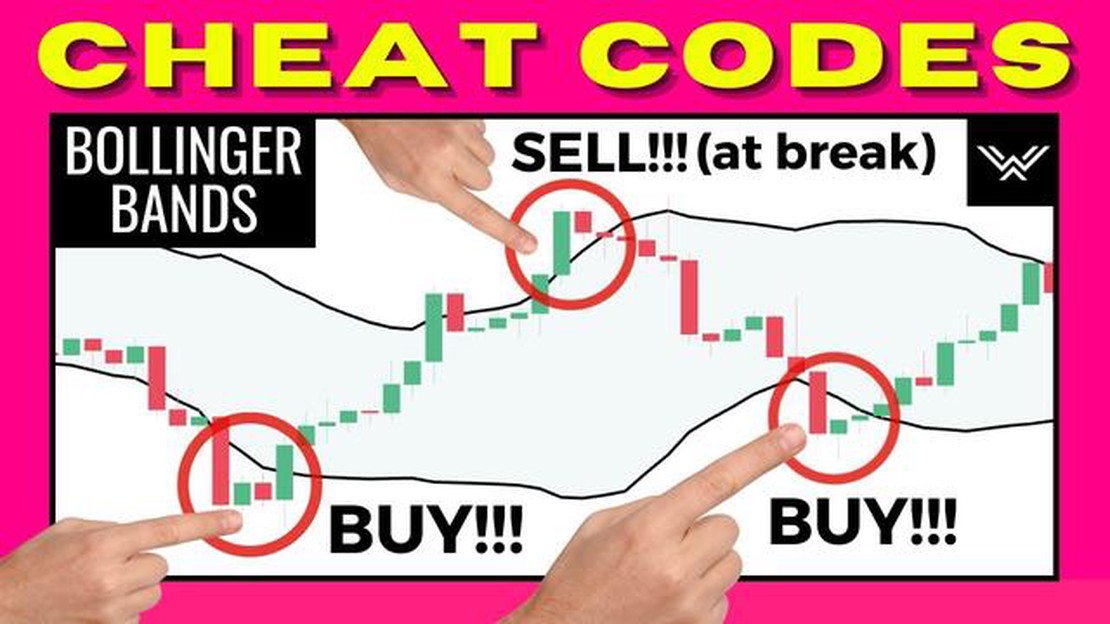
Another strategy is to use Bollinger Bands as a support and resistance indicator. When the price touches the lower band, it may indicate a potential buying opportunity, as the price is considered oversold. Conversely, when the price touches the upper band, it may indicate a potential selling opportunity, as the price is considered overbought.
Overall, Bollinger Bands provide a useful tool for analyzing price volatility and identifying potential trading opportunities. By understanding how the bands are constructed and how to interpret their signals, traders can make more informed decisions and improve their overall trading performance.
Bollinger Bands are a popular technical analysis tool used to analyze price volatility. They are named after their creator, John Bollinger, and consist of a three-line chart overlay. The middle line is a simple moving average (SMA), typically based on the closing prices over a specified period. The upper and lower bands are calculated by adding and subtracting a specified number of standard deviations from the middle line.
The purpose of Bollinger Bands is to provide a visual representation of price volatility. The width of the bands expands and contracts with market volatility. When the bands are wider, it suggests higher volatility, and when they are narrower, it suggests lower volatility.
The middle line acts as a reference point for the stock’s price. If the price is consistently above the middle line, it suggests a bullish trend, and if it is consistently below the middle line, it suggests a bearish trend. Traders can use this information to make decisions about buying or selling stocks.

When the price touches or crosses the upper band, it is considered overbought, and traders may consider selling. Conversely, when the price touches or crosses the lower band, it is considered oversold, and traders may consider buying. These bands act as dynamic support and resistance levels.
Read Also: Can you short sell forex? Learn more about short selling in the forex market | Website
Bollinger Bands are also used to analyze patterns and signals. For example, when the price is trending upward and the bands are expanding, it suggests a strong uptrend. Conversely, when the price is trending downward and the bands are contracting, it suggests a strong downtrend. Traders can use these patterns to predict potential reversals or breakouts.
Interpreting Bollinger Bands requires an understanding of the three lines that make up the chart overlay. The middle line represents the average price over a specified period and is often used as a trend indicator. The upper and lower bands represent the standard deviation from the middle line and provide a measure of price volatility.
When the price is trading near the upper band, it suggests that the market is overbought and may be due for a pullback or reversal. Conversely, when the price is trading near the lower band, it suggests that the market is oversold and may be due for a bounce or reversal.
Traders can also look for patterns within the Bollinger Bands. For example, if the price consistently touches the upper band and then pulls back, it may indicate a potential resistance level. On the other hand, if the price consistently touches the lower band and then bounces, it may indicate a potential support level.
It’s important to note that Bollinger Bands are not always accurate indicators of future price movements. They are simply a tool that can help traders identify potential trading opportunities based on price volatility. Traders should always use other technical indicators and analysis methods to confirm signals generated by Bollinger Bands.
Bollinger Bands are a versatile tool for analyzing price volatility. By providing a visual representation of market volatility and identifying overbought and oversold conditions, they can help traders make informed trading decisions. However, it’s important to remember that Bollinger Bands are just one tool in a trader’s toolbox and should be used in conjunction with other analysis methods.
The middle band is a simple moving average (SMA) and represents the average price over a specific period of time, usually 20 periods. The upper and lower bands are calculated by adding and subtracting a certain number of standard deviations from the middle band. The standard deviation is a measure of price volatility.
When the price is within the Bollinger Bands, it is considered to be in a normal trading range. However, when the price reaches the upper band, it is considered to be overbought, and when it reaches the lower band, it is considered to be oversold. Traders often use these levels as potential support and resistance levels to enter or exit trades.
Read Also: Is TMGM Broker Legit? Find Out the Truth in This In-Depth Review
In addition to identifying overbought and oversold levels, the Bollinger Bands can also be used to identify potential breakouts. When the bands contract, it indicates low volatility, and a breakout in price is likely to occur. Conversely, when the bands expand, it indicates high volatility, and a period of consolidation or reversal may follow.

Traders can also use Bollinger Bands to analyze price trends. If the price is consistently trading above the middle band, it may indicate an uptrend, while if the price is consistently trading below the middle band, it may indicate a downtrend. This can help traders identify potential entry points in the direction of the trend.
Overall, the Bollinger Bands is a versatile tool that can be used to analyze price volatility in various market conditions. By understanding how to interpret the bands and identify key levels, traders can make more informed trading decisions and improve their overall profitability.
Bollinger Bands are a technical analysis tool that is used to measure price volatility in financial markets.
Bollinger Bands are calculated using a simple moving average with an added standard deviation. The upper band is calculated by adding two standard deviations to the moving average, while the lower band is calculated by subtracting two standard deviations from the moving average.
The Bollinger Bands indicate levels of price volatility. When the bands are narrow, it suggests low volatility, while wide bands indicate high volatility. The bands can also be used to identify overbought and oversold conditions in the market.
To analyze price volatility using Bollinger Bands, you can look for periods when the price touches or crosses the upper or lower band. These can indicate potential reversals or breakout opportunities. Additionally, you can watch for the bands to narrow after a period of volatility, which may suggest that a new trend is forming.
Bollinger Bands can be a useful tool for analyzing price volatility, but like any technical indicator, they should not be used in isolation. It is important to use them in conjunction with other indicators and to consider other factors such as market conditions and news events before making any trading decisions.

Are Bull Put Spreads Profitable? When it comes to options trading, bull put spreads are a popular strategy among investors. But are they profitable? …
Read Article
Banks Affiliated with PSBank PSBank, which stands for Philippine Savings Bank, is one of the leading banks in the Philippines. It offers a wide range …
Read Article
How to Calculate the Average in OpenOffice If you’re working with data in OpenOffice and need to find the average, you’re in luck. OpenOffice provides …
Read Article
When Do Options Automatically Get Exercised? Options trading is a complex financial instrument that allows investors to speculate on the price …
Read Article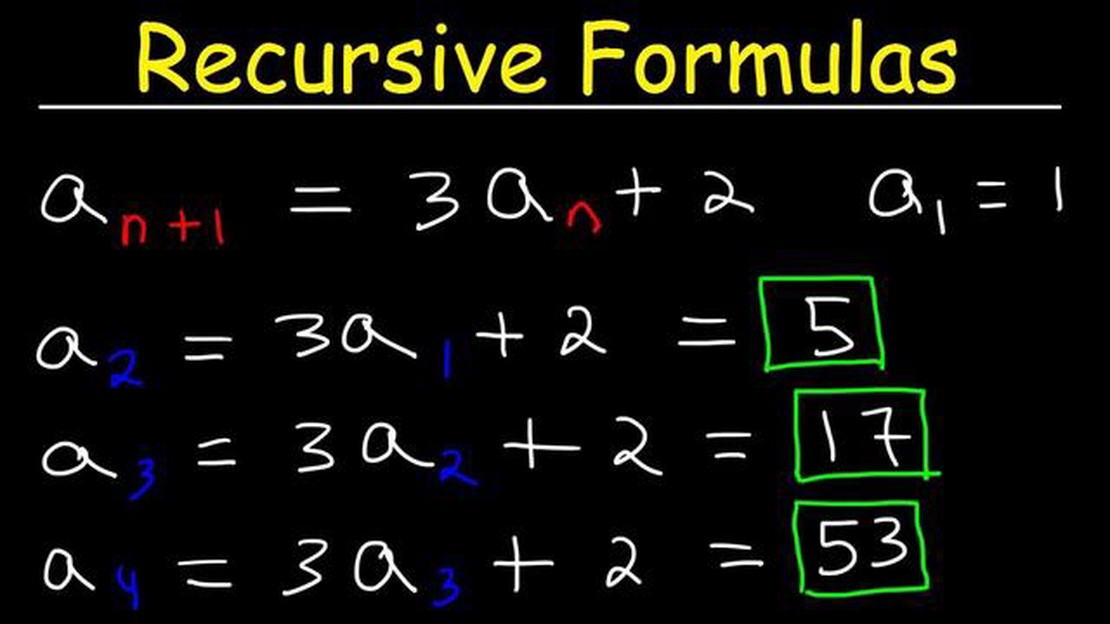
What are examples of recursive patterns? The world around us is filled with intricate patterns that can be found in nature and mathematics. These …
Read Article
Hedging Strategies Using Swap When it comes to managing financial risks, hedging strategies play a crucial role for investors and businesses alike. …
Read Article


