


Understanding the Basics of Employee Stock Options: An Introduction
Employee Stock Option Introduction: Everything You Need to Know Employee stock options are a valuable tool that many companies use to reward and …
Read Article
When it comes to technical analysis in trading, Bollinger Bands are a popular and widely used tool. These bands provide insights into the volatility and potential price moves of a security. Understanding how to calculate Bollinger Bands is essential for any trader looking to effectively utilize this indicator.
The Bollinger Bands formula consists of three components: the SMA (Simple Moving Average), the standard deviation, and the upper and lower bands. The SMA is the average price of a security over a specified period of time. The standard deviation measures the price variability around the SMA, indicating the volatility of the security.
To calculate the Bollinger Bands, we start by calculating the SMA using the closing prices of the security. Then, we calculate the standard deviation using the same closing prices. The upper band is formed by adding two times the standard deviation to the SMA, while the lower band is formed by subtracting two times the standard deviation from the SMA.
For example, if we want to calculate a set of Bollinger Bands for a security with a 20-day period, we would first calculate the 20-day SMA using the closing prices. Next, we calculate the standard deviation for these closing prices. Finally, we add and subtract two times the standard deviation from the SMA to form the upper and lower bands.
Bollinger Bands can be a valuable tool for traders in identifying potential price trends and reversals. By understanding the components and calculation of Bollinger Bands, traders can effectively utilize this indicator to make informed trading decisions.
Bollinger Bands are a popular technical analysis tool used to measure volatility in financial markets. They consist of a simple moving average (SMA) and two standard deviation lines, known as the upper and lower bands. The formula for calculating Bollinger Bands involves the following steps:
The Bollinger Bands formula can be summarized as follows:
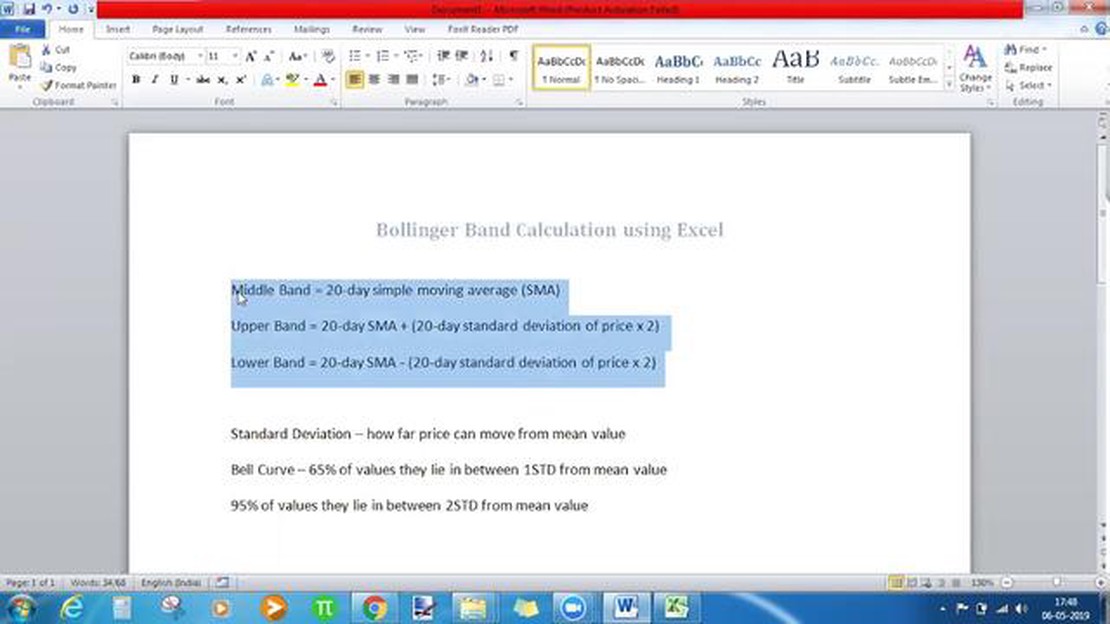
Middle Band (20-day SMA) = Sum of Closing Prices / 20

Standard Deviation = Square Root of [(Sum of (Closing Prices - 20-day SMA)^2) / 20]
Upper Band = Middle Band + (2 * Standard Deviation)
Lower Band = Middle Band - (2 * Standard Deviation)
Bollinger Bands are typically plotted on a price chart, with the middle band representing the SMA and the upper and lower bands showing the range within which the price is expected to fluctuate. Traders often use Bollinger Bands to identify potential buy or sell signals, as well as to gauge the market’s volatility and overall trend.
Read Also: Is Paper Trading Smart? The Pros and Cons of Simulated Trading
It’s important to note that Bollinger Bands are a dynamic indicator that adjusts to changing market conditions. As volatility increases or decreases, the bands will widen or narrow accordingly. This allows traders to adapt their strategies to different market environments and potentially improve their trading decisions.
The Bollinger Bands indicator is a popular technical analysis tool used by traders to assess the volatility and potential price levels of an asset. It consists of three lines: the middle Band, the upper Band, and the lower Band. The middle Band is a simple moving average (SMA) that represents the average price of the asset over a certain period of time. The upper Band is calculated by adding two standard deviations to the middle Band, while the lower Band is calculated by subtracting two standard deviations from the middle Band.
To calculate the Bollinger Bands, the following steps are taken:
Here is the formula for calculating the Bollinger Bands:
Read Also: Corporate Guarantee Companies in Egypt: Exploring their Role and Significance
| Calculation | Formula |
| --- | --- |
| Middle Band (SMA) | SMA = (Sum of closing prices / Number of periods) |
| Standard Deviation | SD = sqrt((Sum of (closing price - SMA)^2) / Number of periods) |
| Upper Band | Upper Band = Middle Band + (2 * SD) |
| Lower Band | Lower Band = Middle Band - (2 * SD) |
The Bollinger Bands are useful for identifying overbought or oversold conditions in the market. When the price of an asset moves outside the upper or lower Band, it suggests that the asset is overbought or oversold, respectively. Traders can use this information to make trading decisions, such as entering or exiting positions.
It's important to note that Bollinger Bands are not meant to be used as standalone indicators. They should be used in conjunction with other technical analysis tools and market data to confirm trading signals.
[](/sab/)
FAQ:
----
### What are Bollinger Bands?
Bollinger Bands are a technical analysis tool that helps traders and investors to analyze the volatility and potential price levels of a financial instrument or security.
### How are Bollinger Bands calculated?
Bollinger Bands are calculated using a simple moving average (usually a 20-day moving average) as the middle band, and the upper and lower bands are calculated based on the standard deviation of price from the moving average.
### What does it mean when the price touches the upper Bollinger Band?
When the price touches or breaks above the upper Bollinger Band, it could indicate that the security is overbought and potentially due for a correction or reversal in price.
### How can Bollinger Bands help in trading decisions?
Bollinger Bands can help traders in multiple ways. They can be used to identify potential overbought or oversold conditions, spot volatility contractions and expansions, and determine potential support and resistance levels.
### Can Bollinger Bands be used alone for making trading decisions?
Bollinger Bands can be a valuable tool in a trader's toolkit, but they should be used in conjunction with other indicators, chart patterns, and technical analysis techniques to confirm signals and provide a more comprehensive view of market conditions.
### What is the Bollinger Bands formula?
The Bollinger Bands formula is a mathematical formula used to calculate the Bollinger Bands, which are a technical indicator used in financial analysis. The formula calculates a set of bands that correspond to the standard deviation of a stock's price over a given period of time.
### How are Bollinger Bands used in trading?
Bollinger Bands are used in trading to identify potential price reversals and to determine levels of support and resistance. Traders use the bands to gauge the volatility and momentum of a stock. When the price is near the upper band, it is considered overbought, and when it is near the lower band, it is considered oversold. Traders can use these signals to make buy or sell decisions.
See Also:
- Understanding the Golden Cross: Exploring the 200-Day Moving Average
- Methods of Moving Averages: A Comprehensive Guide
- Understanding Psychology Trading: Key Concepts and Strategies
- Is HDFC a reliable choice for international transactions?
- Understanding CCI Buy Signals: A Comprehensive Guide
- Is Binary Options Trading Open on Weekends? Find out Now!
- Understanding Binary Options in Business: A Comprehensive Guide

Employee Stock Option Introduction: Everything You Need to Know Employee stock options are a valuable tool that many companies use to reward and …
Read Article
Is Stock Option Income Considered Earned Income? Stock options are a popular form of compensation for employees, particularly in the high-tech …
Read Article
Is option selling and short selling the same? Option selling and short selling are two distinct investment strategies with different risks and …
Read Article
Northwestern University GPA Requirements: What You Need to Know Northwestern University is a prestigious educational institution known for its …
Read Article
Impact of Employee Stock Option Exercise on the Accounting Equation Employee stock options (ESOs) are a popular form of compensation that companies …
Read Article
Does Warren Buffett trade in options? Warren Buffett, the renowned investor and billionaire, is widely known for his long-term investment approach and …
Read Article


