
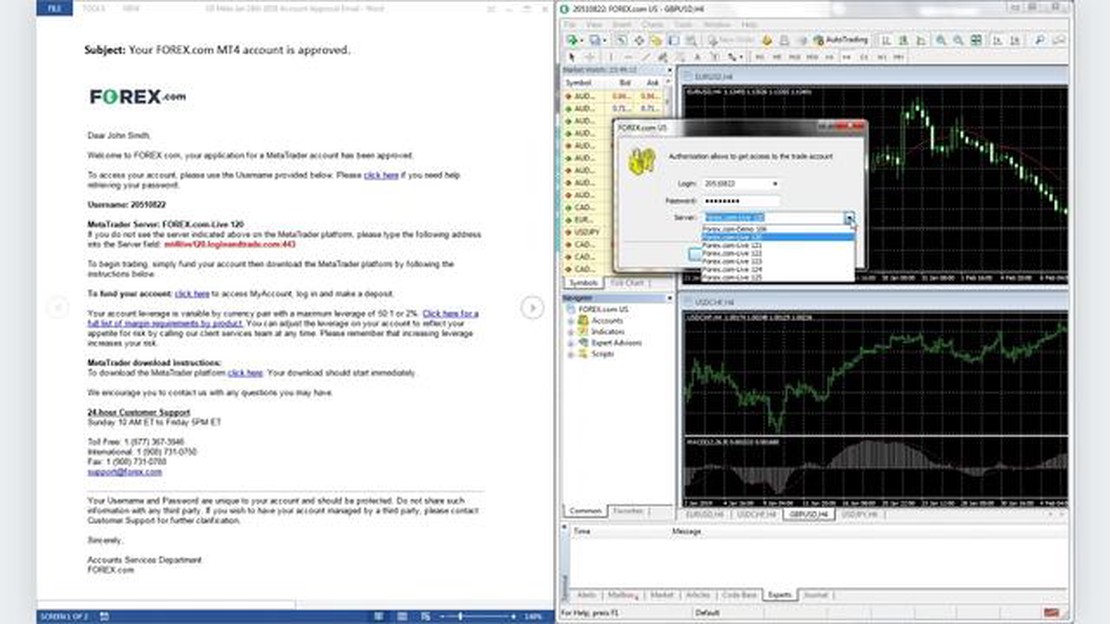

Can I Use MT4 with Forex.com? Your Guide to Trading with MetaTrader 4 on Forex.com
Can I Use MT4 with Forex.com? If you’re looking to trade forex, MetaTrader 4 (MT4) is a popular choice among traders due to its advanced features and …
Read Article
In the fast-paced world of trading, it is crucial to have a deep understanding of technical analysis indicators in order to make informed decisions. One widely used indicator is the Commodity Channel Index (CCI), which is designed to identify trend reversals and overbought/oversold conditions. CCI buy signals play a crucial role in identifying profitable buy opportunities in the market.
The CCI is a versatile indicator that can be applied to various financial markets, such as stocks, commodities, and forex. It measures the difference between the current price and its average price over a specified period of time. The CCI oscillates between -100 and +100, with readings above +100 indicating overbought conditions, and readings below -100 indicating oversold conditions.
When interpreting CCI buy signals, it is important to understand the different types of signals and how they can be used in conjunction with other indicators. One type of CCI buy signal is the bullish divergence, which occurs when the price makes a lower low, but the CCI makes a higher low. This suggests that buying pressure is building, and a potential reversal may occur. Another type of CCI buy signal is the reversal above the -100 level. When the CCI crosses above -100, it indicates that the price may be reversing from oversold conditions and moving towards a buy zone.
In conclusion, understanding CCI buy signals is a valuable skill for traders looking to identify profitable buy opportunities in the market. By combining the CCI with other technical indicators and conducting thorough analysis, traders can increase their chances of success in the fast-moving world of trading.
CCI stands for Commodity Channel Index. It is a technical analysis indicator that was developed by Donald Lambert in 1980. The CCI measures the current price relative to its average price over a specific period of time. It is used to identify overbought or oversold conditions in the market and to generate buy or sell signals.
The CCI is calculated using the following formula:
CCI = (Typical Price - Simple Moving Average) / (0.015 * Mean Deviation)

The CCI oscillates between -100 and +100. Readings above +100 indicate that the price is overbought, while readings below -100 indicate that the price is oversold. Traders use the CCI to identify potential trend reversals and to time their entry and exit points. A CCI reading above +100 suggests a potential sell signal, while a reading below -100 suggests a potential buy signal.
It is important to note that the CCI is a lagging indicator and should be used in conjunction with other technical analysis tools to confirm signals. Additionally, it is essential to consider other factors such as market fundamentals and news events when making trading decisions.
The Commodity Channel Index (CCI) is a popular technical indicator used by traders to identify potential buying opportunities in the market. By analyzing price movements and volatility, CCI helps traders determine when a security is oversold or overbought, leading to potential buy signals.
Here are a few key steps to identify CCI buy signals:
Remember, identifying CCI buy signals is just the first step. It’s crucial to combine CCI analysis with proper risk management strategies and other forms of technical analysis to increase the probability of successful trades.
Read Also: Exploring the Halal or Haram status of Binary Trading
When using the Commodity Channel Index (CCI) to identify potential buy signals, it is important to consider several key indicators. These indicators can help confirm the strength of the buy signal and provide additional insight into market conditions. Here are three key indicators to consider:
1. Oversold Conditions: An oversold condition occurs when the CCI drops below a certain threshold, signaling that the market has been overextended to the downside. This can indicate that sellers have pushed prices too low and a potential buying opportunity may be on the horizon. Traders often look for oversold conditions as a signal to enter a long position.
Read Also: Understanding the EMA Cross Over Strategy: A Step-by-Step Guide
2. Divergence: Divergence occurs when the CCI’s movement diverges from the price action. For example, if the price is making lower lows while the CCI is making higher lows, this could signal that bullish momentum is building. Divergence can be a strong buy signal, as it suggests a potential trend reversal is imminent.
3. Trendline Breakouts: Another key indicator for CCI buy signals is a breakout of a trendline. When the CCI breaks above a downtrend line, it can indicate that the downtrend is ending and a new uptrend is beginning. This breakout can confirm a potential buy signal and provide traders with a clear entry point.
By considering these key indicators, traders can enhance their understanding of CCI buy signals and increase their chances of making successful trades. It is important to remember that no single indicator should be used in isolation, and it is always advisable to use a combination of indicators and other analysis techniques to make informed trading decisions.
CCI stands for Commodity Channel Index. It is a technical analysis indicator used by traders to identify overbought or oversold conditions in the market. CCI helps traders determine potential buy or sell signals, as well as trend strength and market reversals.
CCI is calculated using the typical price of a financial instrument over a specified period of time. The formula for CCI involves taking the difference between the current typical price and its simple moving average, and then dividing it by the mean deviation multiplied by a constant factor. The result is a value that oscillates between overbought and oversold levels.

A CCI buy signal indicates that the market is potentially oversold and could be due for a price increase. When the CCI crosses above the oversold level, it suggests that buying pressure may be entering the market, presenting a potential opportunity for traders to go long on a particular financial instrument.
CCI buy signals should not be relied upon solely for making trading decisions. While they can be helpful indicators, they are not foolproof and can produce false signals. It is recommended to use CCI buy signals in conjunction with other technical analysis tools and indicators to confirm a potential buying opportunity.
When interpreting CCI buy signals, it is important to consider the overall market trend, volume, and other technical indicators. A strong uptrend, high trading volume, and confirmation from other indicators can increase the reliability of a CCI buy signal. Traders should also be cautious of potential false signals and take into account their own risk tolerance and trading strategy.
CCI stands for Commodity Channel Index. It is a technical indicator used in trading to measure the current price level in relation to its average price range over a specific period of time. This indicator helps traders identify overbought and oversold conditions in the market and generates buy or sell signals.
CCI generates buy signals when the indicator crosses above the -100 level. This indicates that the price has reversed from a downtrend and is now potentially entering an uptrend. Traders can use this buy signal to enter a long position and take advantage of the upward price movement.

Can I Use MT4 with Forex.com? If you’re looking to trade forex, MetaTrader 4 (MT4) is a popular choice among traders due to its advanced features and …
Read Article
Is the Iraqi dinar traded on forex? The Iraqi Dinar (IQD) is the official currency of Iraq, and it has attracted the attention of many traders in the …
Read Article
Understanding M1 M2 M3 M4 in Forex Trading Foreign exchange, or forex, trading involves the buying and selling of currencies in order to make a …
Read Article
What is the exchange rate of $1 USD to NGN? Are you looking to convert your US dollars to Nigerian Naira? Knowing the current exchange rate is crucial …
Read Article
Will the Iraqi Dinar Revaluate? The Iraqi Dinar has long been a topic of speculation and debate. With a turbulent history marked by economic, …
Read Article
What is forex buying rate? Forex, or foreign exchange, is a decentralized market for trading different currencies. It is the largest and most liquid …
Read Article


