


Which Timeframe is Better for Scalping? Find Out Here!
Choosing the Best Timeframe for Scalping Forex Markets Scalping is a popular trading strategy that involves making small, quick trades in order to …
Read Article
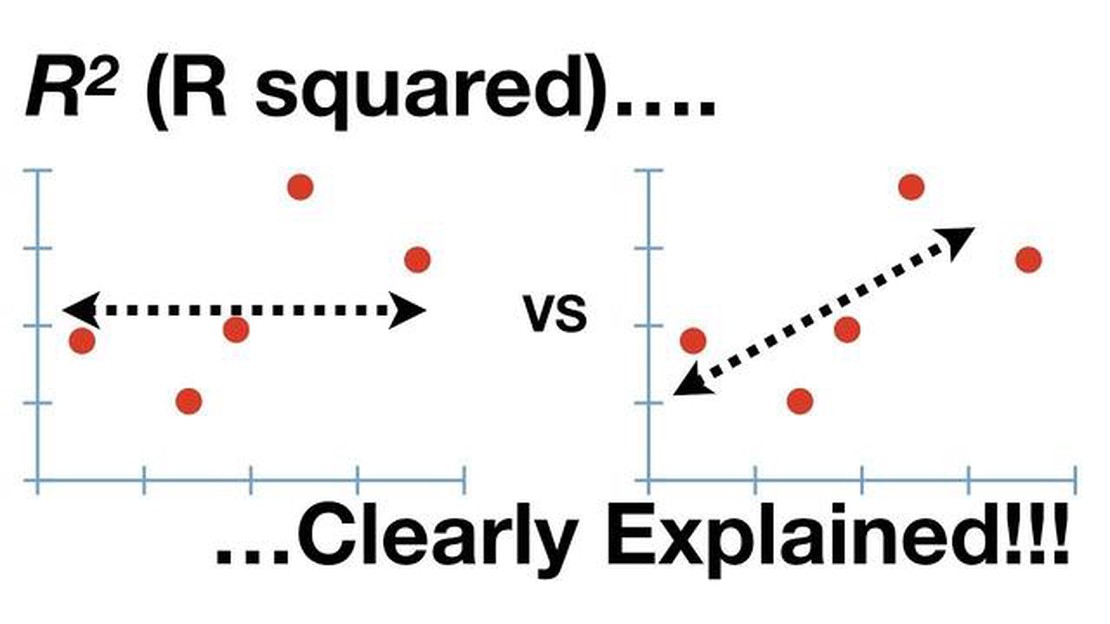
When analyzing data and running regression models, one commonly used measure of goodness-of-fit is the R Squared (R^2) statistic. R Squared represents the proportion of the dependent variable’s variation that can be explained by the independent variables in the model. It ranges from 0 to 1, where 0 indicates that the independent variables explain none of the variation and 1 indicates that they explain all of it.
But what exactly does it mean when we say that an R Squared value is good? Is 50% R Squared considered a good fit for a model? The answer to this question depends on the context and the specific application of the model.
Generally, a higher R Squared value is indicative of a better fit of the model to the data. However, what constitutes a “good” R Squared value varies across different fields and research areas. In some fields, such as social sciences, an R Squared value of 50% may be considered quite good, as it suggests that 50% of the variation in the dependent variable is explained by the independent variables. On the other hand, in fields like physics or engineering, where data is expected to be more precise and predictable, a higher R Squared value might be required to consider the model as a good fit.
It is important to note that R Squared should not be the sole criterion for evaluating the quality of a statistical model. Other measures, such as p-values, confidence intervals, and the overall theoretical framework, should also be taken into consideration.
Ultimately, the interpretation of an R Squared value as “good” or “bad” depends on the specific research context and the goals of the analysis. It is always advisable to consult with domain experts and consider the theoretical implications of the model before making conclusions based solely on the R Squared statistic.
When analyzing statistical data, one of the metrics that is commonly used to measure the goodness of fit for a regression model is R-squared (R²). R-squared represents the proportion of the variance in the dependent variable that can be explained by the independent variable(s) in the model. It ranges from 0 to 1, where 0 indicates that the model does not explain any of the variability in the dependent variable, and 1 indicates a perfect fit.

In general, a higher R-squared value is considered better as it suggests that a larger proportion of the variance is accounted for by the model. However, the interpretation of R-squared depends on the specific context and the field of study.
When it comes to evaluating the significance of an R-squared value of 50%, it is important to consider the nature of the data being analyzed and the research question at hand. In some fields, such as social sciences, an R-squared of 50% may be considered quite good, as it can be challenging to explain a large portion of the variance in human behavior or other complex phenomena. On the other hand, in fields like physical sciences or engineering, a lower R-squared value may not be acceptable, as there might be simple relationships or laws that can explain a higher proportion of the variance.
Additionally, it is important to look at other statistical measures, such as the p-value or the standard error of the regression coefficients, to fully evaluate the significance of the R-squared value. These measures can provide insights into the precision and reliability of the estimated regression coefficients.
Read Also: Botswana's Exchange Rate: Do They Have a Fixed Rate or Flexible System?
Furthermore, it is worth considering the specific goals of the analysis. If the goal is to predict the dependent variable accurately, an R-squared value of 50% may be considered acceptable. However, if the goal is to uncover causal relationships or explain the underlying mechanisms, a higher R-squared value may be desired.
| R-squared Value | Interpretation |
|---|---|
| 0-0.3 | Weak relationship |
| 0.3-0.5 | Moderate relationship |
| 0.5-0.7 | Strong relationship |
| 0.7-1 | Very strong relationship |
Ultimately, the significance of an R-squared value depends on the specific context and research question. It is important to consider the field of study, the nature of the variables being analyzed, and the goals of the analysis when determining whether a 50% R-squared is good or not.
In statistical analysis, R Squared (R^2) is a common metric used to assess the goodness of fit of a regression model. It provides an indication of how well the dependent variable is explained by the independent variables in a linear regression model.
R Squared ranges from 0 to 1, with a value of 1 indicating a perfect fit, meaning that all of the variation in the dependent variable can be explained by the independent variables. On the other hand, a value of 0 suggests that the independent variables have no predictive power in explaining the variation in the dependent variable.
However, it is important to note that R Squared should not be interpreted as a measure of the model’s accuracy or reliability. It only describes the proportion of the dependent variable’s variance that is captured by the independent variables. Therefore, even a high R Squared value does not necessarily mean that the model is a good predictor.
Moreover, R Squared can be misleading when used in the context of complex regression models or when comparing models with different sets of independent variables. It tends to increase as more independent variables are added to the model, even if they are not important in predicting the dependent variable. This is known as the “overfitting” problem.
Therefore, it is crucial to consider other metrics, such as adjusted R Squared, AIC, BIC, or out-of-sample validation, in conjunction with R Squared to obtain a comprehensive understanding of the model’s performance.
Read Also: Understanding the Significance and Definition of the Atlantic System
In conclusion, R Squared is a valuable metric in statistical analysis that provides an indication of how well the independent variables explain the variation in the dependent variable. However, it should be used cautiously and in conjunction with other metrics to fully evaluate the model’s performance and predictive power.
R-Squared (R²) is a statistical measure that represents the proportion of the variation in the dependent variable that can be explained by the independent variables in a regression model. It is important because it provides insights into the goodness-of-fit of the model, indicating how well the independent variables are able to explain the variation in the dependent variable.
It depends on the context and the field of study. In some fields, a 50% R-Squared may be considered relatively good, while in other fields, it may be considered low. It is important to compare the R-Squared value with the R-Squared values of other similar models or benchmarks in the field to determine its significance.

When interpreting R-Squared, it is important to consider the context, the field of study, the complexity of the model, and the availability of additional explanatory variables. Additionally, it is important to compare the R-Squared value with benchmarks or other similar models to determine its significance.
No, a high R-Squared value does not necessarily guarantee the accuracy of the predictions. While a high R-Squared value indicates a good fit of the model to the data, it does not guarantee that the model will make accurate predictions for new or unseen data. It is important to assess the model’s performance using other metrics such as Mean Squared Error or cross-validation.
R-Squared has several limitations. It is sensitive to the number of independent variables in the model, as adding more variables can artificially inflate the R-Squared value. Additionally, R-Squared does not indicate the causality of relationships between variables and cannot account for nonlinear relationships. Therefore, it is important to interpret R-Squared in conjunction with other statistical measures and consider the limitations of the model.
R Squared is a statistical measure that represents the proportion of the variance in the dependent variable that can be explained by the independent variables in a regression model. It is important in statistical analysis because it helps to assess the goodness-of-fit of the model and the strength of the relationship between the independent and dependent variables.

Choosing the Best Timeframe for Scalping Forex Markets Scalping is a popular trading strategy that involves making small, quick trades in order to …
Read Article
How to Find Your Bank Code in Singapore When it comes to banking in Singapore, knowing your bank code is essential. Your bank code is a unique …
Read Article
What is GID in Morgan Stanley? In the world of finance, understanding the various terminologies and acronyms is crucial. One such term that is often …
Read Article
Compensation strategies for CFOs When it comes to the compensation of a Chief Financial Officer (CFO), companies need to carefully consider the best …
Read Article
Cost of Options Trading in Icicidirect Options trading continues to grow in popularity as investors seek alternative investment strategies. …
Read Article
What is the Best Volume Indicator for Forex TradingView? When it comes to forex trading, having access to accurate and reliable indicators can make …
Read Article


