
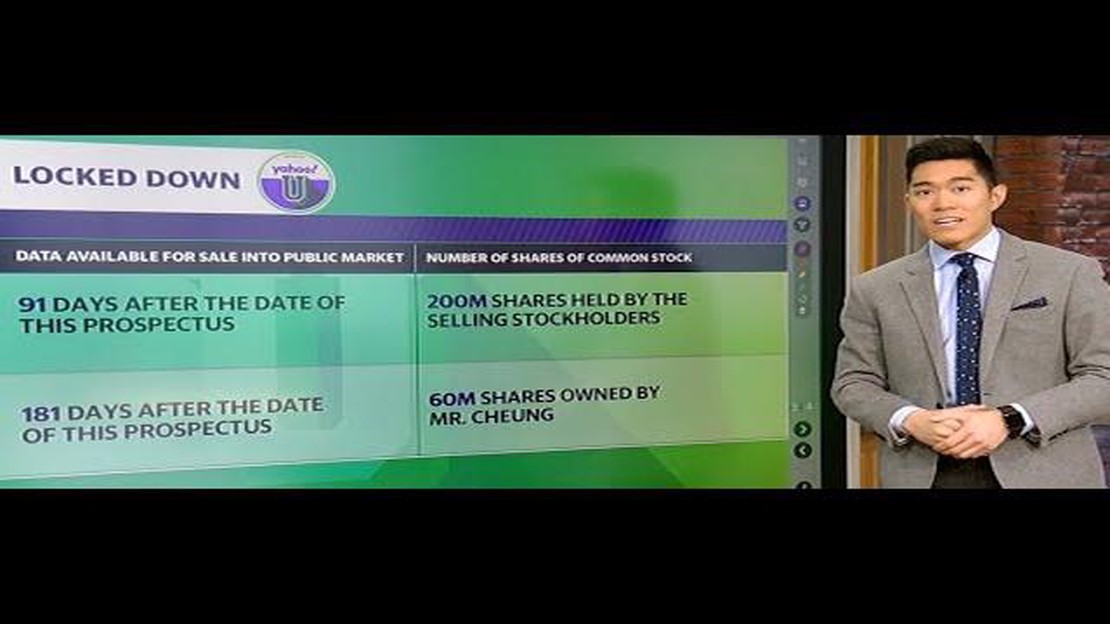

Understanding the Lock-Up Period for Stock Options: Everything You Need to Know
Understanding the Lock-Up Period for Stock Options When it comes to stock options, one term that often comes up is the lock-up period. But what …
Read Article
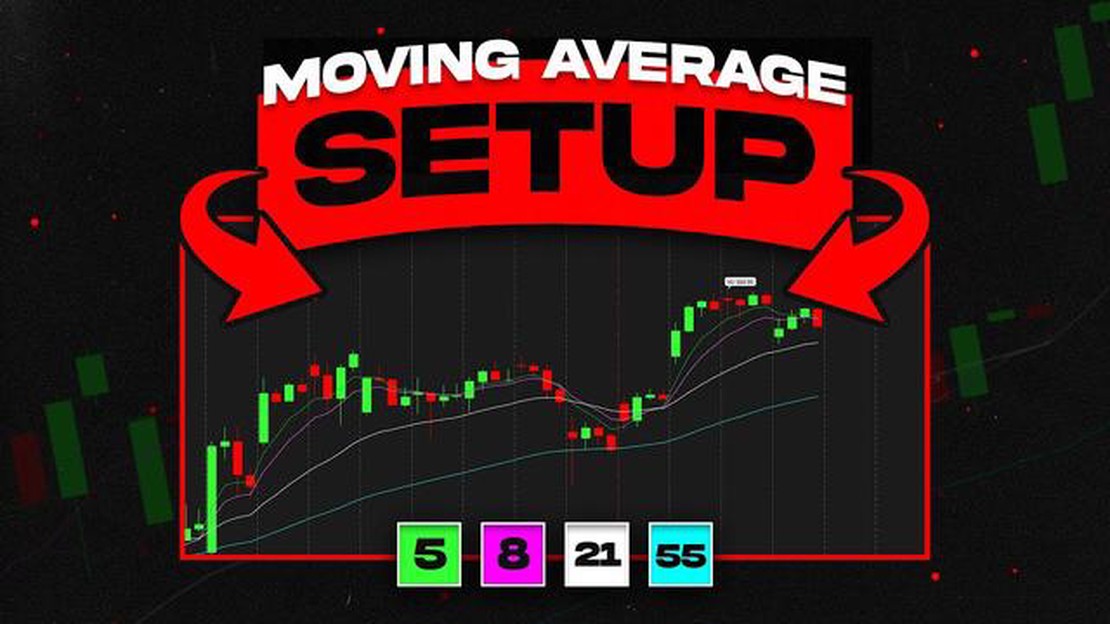
If you are new to trading or are looking to improve your technical analysis skills, understanding how to set up a moving average can be incredibly beneficial. A moving average is a commonly used tool in technical analysis that helps traders identify trends and potential entry or exit points in the market. By calculating the average price of a security over a specific period of time, moving averages smooth out the price data and provide traders with a clearer picture of the overall trend.
To set up a moving average, follow these step-by-step instructions:
By following these steps, you will be able to set up a moving average and use it as a powerful tool in your trading arsenal. Remember, moving averages are just one tool in a trader’s toolbox and should always be used in conjunction with other technical analysis indicators and risk management strategies.
A moving average is a commonly used statistical calculation that helps identify trends or patterns in data. It is often used in financial analysis and technical analysis to smooth out fluctuations and noise in a dataset.
The moving average is calculated by taking the average of a specified number of data points over a certain period of time. For example, a 10-day moving average would calculate the average of the past 10 days’ closing prices.
The moving average can be calculated using different methods, such as simple moving average (SMA) or exponential moving average (EMA). The SMA calculates the average of the data points over the specified period, while the EMA gives more weight to recent data points.
By plotting the moving average on a chart, analysts can spot trends and patterns more easily. If the moving average is increasing, it indicates an uptrend, while a decreasing moving average suggests a downtrend. Crossovers of different moving averages can also provide buy or sell signals.
| Period | Data | Simple Moving Average | Exponential Moving Average |
|---|---|---|---|
| 1 | 10 | 10 | 10 |
| 2 | 12 | 11 | 11.17 |
| 3 | 14 | 12 | 12.33 |
| 4 | 13 | 12.25 | 12.77 |
| 5 | 15 | 12.8 | 13.51 |

In this example, the simple moving average for a 5-day period is calculated by taking the average of the last 5 data points. The exponential moving average places more weight on recent data points, resulting in a slightly different value.
Moving averages can be a valuable tool for traders and analysts to analyze trends and make informed decisions. It is important to choose the appropriate period and method for calculating the moving average based on the specific application and purpose.
A moving average is a popular technical analysis tool used by traders and investors to identify trends and make informed decisions about buying or selling securities. Here are several reasons why using a moving average can be beneficial:
Read Also: Is the Australian Dollar Likely to Strengthen or Weaken?
Trend identification: Moving averages are designed to smooth out price data and help traders identify the direction of the underlying trend. By calculating the average price over a specific time period, moving averages provide a clearer picture of the overall market movement.
Support and resistance levels: Moving averages can serve as dynamic support or resistance levels. Traders often use moving averages as reference points to determine areas of potential buying or selling pressure. When the price is above the moving average, it may act as a support level. Conversely, when the price is below the moving average, it may act as a resistance level.
Entry and exit signals: Moving averages can generate signals for when to enter or exit a trade. For example, a common strategy is to buy when the price crosses above the moving average and sell when the price crosses below it. These crossovers can signal potential changes in market direction and help traders make timely trading decisions.
Filtering out noise: Moving averages can help filter out short-term price fluctuations and focus on the underlying trend. By smoothing out the price data, moving averages provide a clearer view of the market’s overall movement, reducing the impact of temporary price spikes or dips.
Read Also: Is Technical Analysis Difficult to Learn? Tips for Mastering Technical Analysis
Confirmation of trends: Moving averages can be used as confirmation tools to validate the presence of a trend. When multiple moving averages of different time periods are plotted on a chart, their crossovers or alignment can indicate the strength and sustainability of a trend. Traders often look for the alignment of shorter-term and longer-term moving averages to confirm the direction of a trend.
Risk management: Moving averages can also be used in risk management strategies. Traders may set stop-loss orders based on the distance from the current price to the moving average. By setting the stop-loss level below the moving average in an uptrend or above the moving average in a downtrend, traders can limit potential losses and protect their capital.
In conclusion, moving averages can be a valuable tool in a trader’s toolkit. Whether it’s to identify trends, determine support and resistance levels, generate entry and exit signals, filter out noise, confirm trends, or manage risk, moving averages can provide valuable insights into the market’s price action.

A moving average is a commonly used technical indicator that shows the average price of a security over a specific period of time. It is calculated by adding up all the closing prices over the time period and dividing it by the number of periods.
A moving average can be used to smooth out price fluctuations and identify the overall trend of a security. It can also be used to generate trading signals, with buy signals occurring when the price crosses above the moving average, and sell signals occurring when the price crosses below the moving average.
To set up a moving average on a chart, first you need to select the desired time period for the moving average. Then, you need to choose the type of moving average you want to use, such as a simple moving average or an exponential moving average. Finally, you can customize the color and line style of the moving average on the chart.
The main difference between a simple moving average (SMA) and an exponential moving average (EMA) is that the EMA gives more weight to recent prices, while the SMA treats all prices equally. This means that the EMA reacts faster to price changes and is more responsive to the current market conditions.
Yes, you can use multiple moving averages on one chart. This is called a moving average crossover strategy, where you look for buy or sell signals when two or more moving averages cross over each other. For example, a common strategy is to buy when a shorter-term moving average crosses above a longer-term moving average, and sell when the shorter-term moving average crosses below the longer-term moving average.
A moving average is a calculated average of a set of data points over a specific period of time, where the average “moves” as new data points are added and old data points are dropped.
Setting up a moving average is important for traders and investors as it helps them identify trends and make more informed decisions about buying or selling assets. It smooths out the fluctuations in data, making it easier to spot patterns and determine the overall direction of the market.

Understanding the Lock-Up Period for Stock Options When it comes to stock options, one term that often comes up is the lock-up period. But what …
Read Article
Understanding the Difference between a Forex Card and a Credit Card When it comes to international travel or online shopping from foreign websites, …
Read Article
Should I Follow Forex Signals? Forex trading has become increasingly popular in recent years as individuals look for ways to make money from home. One …
Read Article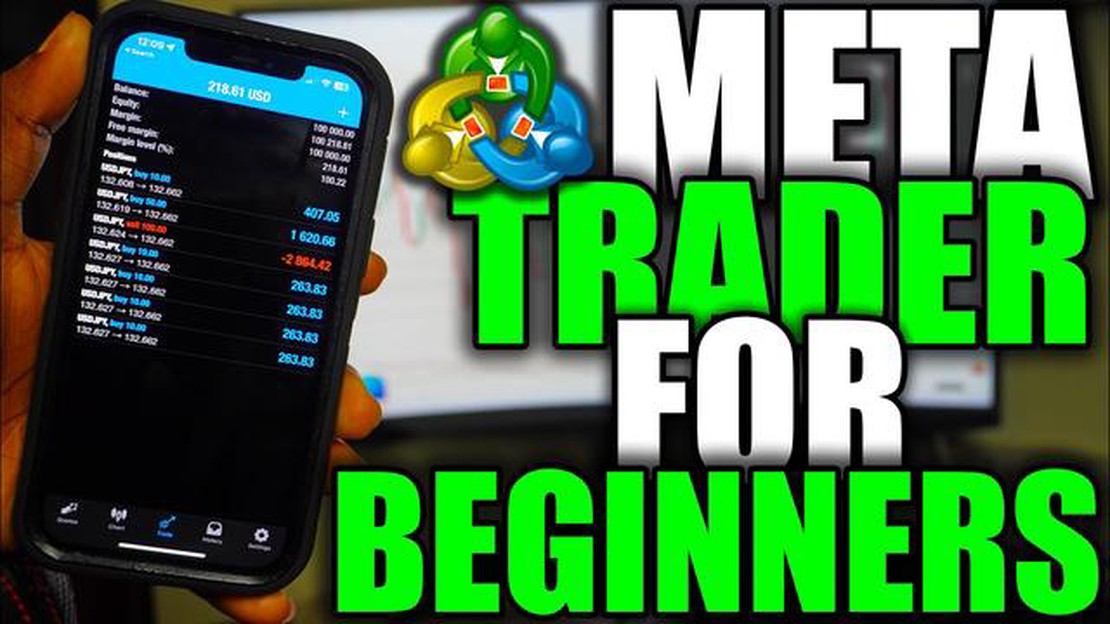
How to Use MetaTrader 4 with Forex.com If you are new to trading in the foreign exchange market, one of the most popular and widely used trading …
Read Article
Exploring FTSE 100 Options: An In-Depth Analysis Options trading can be an excellent way for investors to diversify their portfolios and potentially …
Read Article
Forex Market Closure Time on Friday in the UK If you’re an active trader in the forex market, it’s important to know when the market closes on Fridays …
Read Article

