

What is the Value of $1000 American Express?
How much is $1000 American Express? American Express is one of the leading financial services companies in the world. It offers a wide range of credit …
Read Article
Bollinger Bands are a popular technical analysis tool used by traders to identify potential price reversals and detect overbought or oversold conditions in the market. They consist of three lines: a middle line that is usually a simple moving average (SMA), and an upper and lower line that represent the standard deviations of the price from the middle line.
While the middle line of Bollinger Bands is typically a SMA, some traders wonder whether it would be more effective to use an exponential moving average (EMA) instead. The choice between SMA and EMA can have a significant impact on the interpretation of Bollinger Bands and the signals they generate.
Proponents of using SMA argue that it provides a more stable and less reactive signal compared to EMA. SMA is calculated by taking the average closing price over a specific time period, giving equal weight to each data point. This smooths out short-term fluctuations and provides a more balanced view of price movement. On the other hand, EMA gives more weight to recent price data, making it more responsive to changes in price.
Ultimately, the choice between SMA and EMA for Bollinger Bands depends on the trader’s individual strategy and preferences. Some traders may prefer the stability of SMA, while others may find the responsiveness of EMA more useful for identifying short-term trends and capturing quick profit opportunities. It’s important to experiment with different moving averages and find the one that works best for your trading style and goals.
Bollinger Bands are a popular technical analysis tool that was developed by John Bollinger in the 1980s. They are used to measure volatility and identify potential price reversals in financial markets. One of the key components of Bollinger Bands is the moving average, which helps to determine the centerline of the bands.
The moving average used in Bollinger Bands is typically a simple moving average (SMA), although some traders also use the exponential moving average (EMA). The choice between SMA and EMA depends on the trader’s preference and trading strategy.
A simple moving average is calculated by summing up a set number of closing prices over a specific period and then dividing the sum by the number of periods. This moving average gives equal weight to each price point in the calculation, making it more responsive to recent price changes. However, it may be slower to react to larger price movements compared to an exponential moving average.
On the other hand, an exponential moving average assigns more weight to recent price data. It uses a smoothing factor to give greater importance to the most recent data points, making it more responsive to short-term price changes. This can be advantageous when markets are experiencing high volatility.
Both SMA and EMA have their advantages and disadvantages, and traders may choose one over the other based on their analysis and trading style. Bollinger Bands themselves are based on a set number of standard deviations away from the moving average, which helps to identify the upper and lower bands. By using a moving average in conjunction with the standard deviations, Bollinger Bands provide a visual representation of price volatility and potential support and resistance levels.

In conclusion, Bollinger Bands use a moving average as a key component, and traders can choose between using a simple moving average (SMA) or an exponential moving average (EMA). Both moving averages have their own characteristics and can be effective in different market conditions. The choice ultimately depends on the trader’s preference and trading strategy.
Bollinger Bands are a technical analysis tool that was developed by John Bollinger in the early 1980s. They are a widely used indicator in financial markets to help traders identify potential buy and sell signals.
Read Also: Understanding Currency Swap Policy: A Comprehensive Guide
Bollinger Bands consist of a middle band, which is usually a simple moving average (SMA) of the price, and an upper and lower band, which are typically two standard deviations away from the middle band. The upper and lower bands act as dynamic support and resistance levels, providing traders with a visual representation of price volatility.
The width of the bands is based on the volatility of the market. During periods of increased volatility, the bands expand, indicating wider price ranges. Conversely, during periods of decreased volatility, the bands contract, indicating narrower price ranges.
Traders often use Bollinger Bands to identify overbought and oversold conditions in the market. When the price touches or crosses the upper band, it may signal that the market is overbought, and a reversal or correction may be imminent. Similarly, when the price touches or crosses the lower band, it may signal that the market is oversold, and a potential buying opportunity may be present.
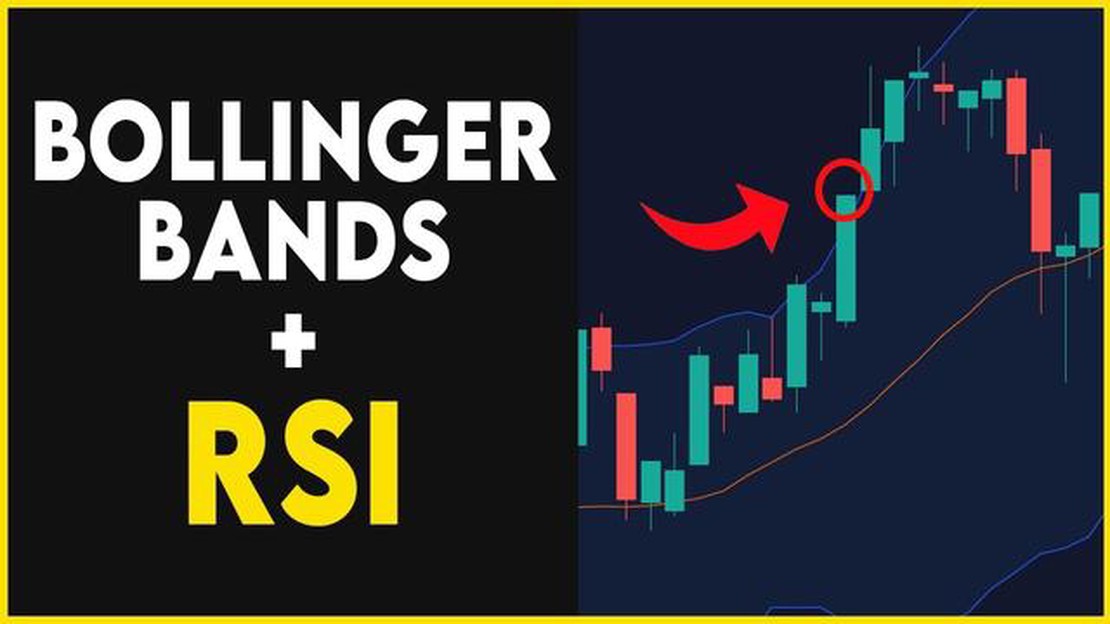
Bollinger Bands can also be used in conjunction with other technical indicators to enhance trading strategies. For example, some traders may use Bollinger Bands in combination with the Relative Strength Index (RSI) to confirm potential buy or sell signals.
It is important to note that Bollinger Bands are a lagging indicator, as they are based on historical price data. Therefore, they should not be used as the sole basis for making trading decisions. Traders should consider using them in conjunction with other analysis techniques and risk management strategies.
In summary, Bollinger Bands are a versatile technical analysis tool that can help traders identify potential buy and sell signals, as well as gauge market volatility. Understanding how to interpret and use Bollinger Bands can contribute to a more informed trading strategy.
When it comes to Bollinger Bands, both Simple Moving Average (SMA) and Exponential Moving Average (EMA) can be used. However, the default setting for the moving average in Bollinger Bands is the Simple Moving Average (SMA).
The Simple Moving Average (SMA) is calculated by taking the sum of a set number of periods (e.g., 20) and dividing it by the number of periods. This moving average gives equal weight to each data point in the calculation.
Read Also: Exploring Employee Stock Options and their Potential Premium
On the other hand, the Exponential Moving Average (EMA) is a weighted moving average that gives more weight to recent data points. This means that the EMA is more reactive to recent price changes compared to the SMA.
While both the SMA and EMA can be used in conjunction with Bollinger Bands, the choice between the two depends on the trader’s preference and trading strategy. The SMA is often preferred for its simplicity and smoother movements, while the EMA is favored for its responsiveness to recent price changes.

Ultimately, it is up to the trader to decide which moving average to use with Bollinger Bands, based on their own trading style and preferences.
Bollinger Bands are a technical analysis tool that consists of a set of three lines plotted on a price chart. The middle line is a simple moving average (SMA), and the upper and lower lines are the standard deviations above and below the SMA.
Bollinger Bands typically use the simple moving average (SMA) as the middle line. However, some traders prefer to use the exponential moving average (EMA) instead.
The simple moving average (SMA) calculates the average price over a specific period of time, giving equal weight to each data point. The exponential moving average (EMA), on the other hand, places more weight on recent data, making it more responsive to price changes.
There is no definitive answer to which moving average is better for Bollinger Bands. It ultimately depends on the trader’s preference and trading strategy. Some traders find that the EMA provides a more accurate representation of recent price movements, while others prefer the simplicity of the SMA.
Bollinger Bands are used in technical analysis to identify periods of high or low volatility in a market. When the price is near the upper band, it is considered overbought, and when it is near the lower band, it is considered oversold. Traders often use Bollinger Bands to generate buy or sell signals based on price breakouts or reversals.
Bollinger Bands are a technical analysis tool developed by John Bollinger. They are used to measure volatility and identify potential overbought or oversold conditions in a market.

How much is $1000 American Express? American Express is one of the leading financial services companies in the world. It offers a wide range of credit …
Read Article
Understanding the Taxation of Non-Qualified Stock Options Non-qualified stock options (NQSOs) are a popular form of employee compensation that allow …
Read Article
What is zero forex? Welcome to our comprehensive guide on Zero Forex, a term that refers to the concept of zero commission or zero spread trading in …
Read Article
How to Play Marvel Match Marvel Match is a highly addictive and strategic puzzle game that has taken the gaming world by storm. With its vibrant comic …
Read Article
How to Calculate Annual Growth Rate Over 4 Years The annual growth rate is a crucial metric for evaluating the performance of a company, investment, …
Read Article
How to Grow $10 in Forex? Forex, or foreign exchange, is a global market where currencies are traded. It offers individuals an opportunity to …
Read Article


