


Is it good to invest in H&?
Is it good to invest in H& Investing in H&M can be a profitable venture for those who are looking to diversify their portfolio and capitalize on the …
Read Article
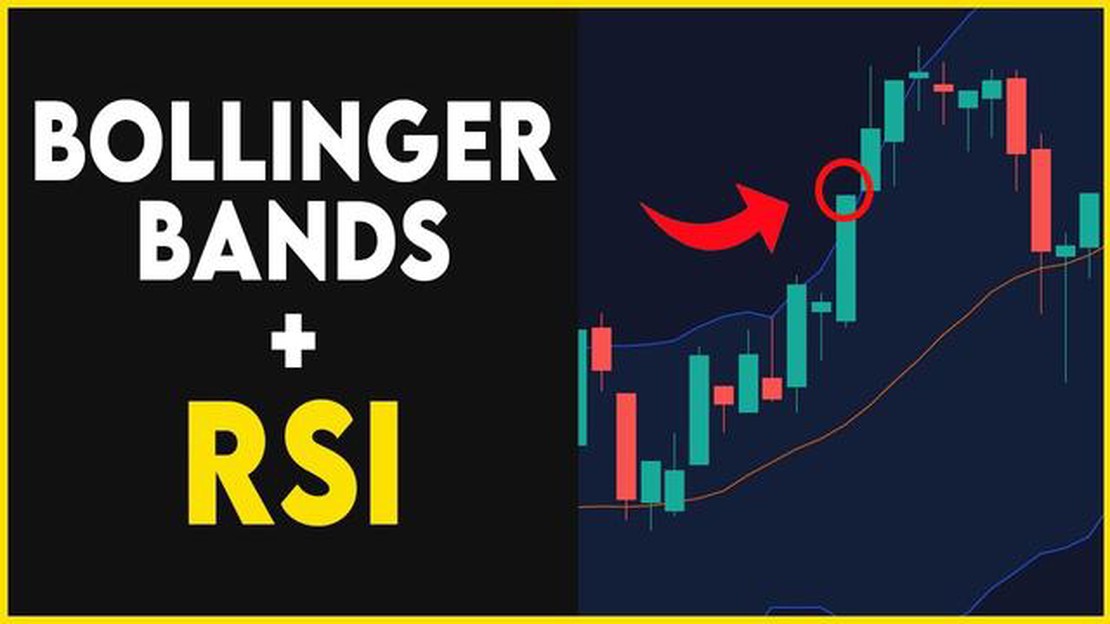
When it comes to trading in the stock market, timing is everything. Traders are constantly on the lookout for indicators that can give them an edge in predicting when to buy or sell a stock. One popular indicator that has gained a lot of attention is the Bollinger Bands.
Bollinger Bands are a technical analysis tool that consists of a middle band, an upper band, and a lower band. The middle band is typically a simple moving average, while the upper and lower bands are usually two standard deviations away from the middle band. Traders use Bollinger Bands to identify potential overbought or oversold conditions in a stock.
So, when is the best time to buy or sell using Bollinger Bands? One strategy is to look for a stock that has been trading near the lower band for a period of time. This could indicate that the stock is oversold and due for a bounce back. Traders might consider buying the stock at this point, hoping to profit from a potential price increase.
On the other hand, if a stock has been trading near the upper band for a while, it could be a sign that the stock is overbought and due for a correction. Traders might consider selling the stock at this point, expecting the price to decrease in the near future.
It’s important to note that Bollinger Bands should not be used in isolation. Traders should consider other technical indicators and factors, such as volume and market trends, before making a decision to buy or sell a stock. Additionally, Bollinger Bands are not foolproof and can provide false signals. Therefore, it’s always wise to perform thorough research and analysis before making any trading decisions.
In conclusion, the best time to buy or sell using Bollinger Bands is when a stock has been trading near the lower band or upper band for an extended period. This could indicate potential oversold or overbought conditions, respectively. However, traders should use Bollinger Bands in conjunction with other indicators and perform thorough analysis before making any trading decisions.
Bollinger Bands, developed by John Bollinger in the 1980s, are a popular technical analysis tool used by traders to determine potential price reversals and identify trading opportunities in financial markets.
The Bollinger Bands consist of three lines plotted on a price chart. The middle line represents a simple moving average (SMA) of the asset’s price over a specified time period. The upper and lower lines, called the upper band and lower band, are calculated by adding and subtracting a certain number of standard deviations from the middle line. The standard deviation is a measure of price volatility, and the number of standard deviations used determines the width of the bands.
The significance of Bollinger Bands lies in their ability to provide important information about the volatility and potential direction of the price. When the price is trading within the bands, it indicates a period of consolidation or range-bound trading. Conversely, when the price reaches the upper or lower band, it suggests that the price may be overbought or oversold, respectively, and a reversal in the price trend may occur.

Traders often use Bollinger Bands in conjunction with other technical indicators or chart patterns to strengthen their trading signals. For example, a trader may look for a bullish or bearish divergence between the price and an oscillator indicator when the price reaches the upper or lower band, respectively, to confirm a potential reversal.
Read Also: The Pros and Cons of Using Moving Averages
Additionally, Bollinger Bands can be used to identify volatility breakouts. When the bands contract, it suggests that the market is experiencing low volatility, and a breakout may be imminent. Traders can look for a strong move in the price once the bands start expanding, indicating an increase in volatility.
| Key Points |
|---|
| • Bollinger Bands consist of a middle line (SMA) and upper and lower bands. |
| • The width of the bands is determined by the number of standard deviations. |
| • Trading within the bands suggests consolidation, while reaching the bands indicates potential reversal. |
| • Bollinger Bands can be used in conjunction with other indicators to confirm trading signals. |
| • The contraction and expansion of the bands can indicate changes in volatility. |
In conclusion, understanding Bollinger Bands and their significance can be a valuable tool for traders in timing their buy or sell decisions. By analyzing the price in relation to the bands and considering other technical indicators, traders can gain insights into potential price reversals and volatility breakouts, enhancing their trading strategies.
Timing plays a crucial role in the success of trading and investing, and this holds true when using Bollinger Bands as well. Bollinger Bands are a technical analysis tool that helps traders identify potential price reversals and market trends. However, without proper timing, the effectiveness of using Bollinger Bands can be greatly reduced.
One of the key concepts in timing your buying and selling decisions with Bollinger Bands is understanding the concept of overbought and oversold conditions. Bollinger Bands consist of three lines - the upper band, middle band, and lower band. The middle band represents the simple moving average, while the upper and lower bands represent the standard deviations from the moving average.
When the price of an asset touches or goes above the upper band, it indicates that the market is overbought, and a reversal to the downside may be imminent. On the other hand, when the price touches or goes below the lower band, it suggests that the market is oversold, and a potential reversal to the upside may occur.
Timing becomes crucial in these situations. Buying or selling at the exact moment when the price touches the outer bands can lead to profitable trades. However, if the timing is not precise, traders may end up entering or exiting their positions too soon or too late, resulting in missed opportunities or losses.
Another aspect to consider when timing your buying and selling decisions using Bollinger Bands is the confirmation of signals. Bollinger Bands should not be used in isolation but rather in conjunction with other technical indicators to confirm trading signals. Relying solely on Bollinger Bands may increase the risk of false signals and inaccurate timing.
Read Also: Understanding the RSI with MA Strategy: A Comprehensive Guide
For example, traders may combine Bollinger Bands with other indicators such as the Relative Strength Index (RSI) or the Moving Average Convergence Divergence (MACD). If these indicators provide confirmation of the overbought or oversold conditions identified by Bollinger Bands, it can increase the confidence in the timing of the buying or selling decision.

In conclusion, timing is crucial when using Bollinger Bands for buying and selling decisions. Traders must pay close attention to the overbought and oversold conditions indicated by the bands and use additional indicators to confirm these signals. By mastering the art of timing, traders can maximize their profits and minimize their losses in the market.
Bollinger Bands are a technical analysis tool that consists of a middle band, an upper band, and a lower band. The middle band is usually a simple moving average, while the upper and lower bands are placed at a certain number of standard deviations from the middle band. Bollinger Bands help traders identify volatility and price levels that are overbought or oversold.
The best time to use Bollinger Bands is when the market is ranging or consolidating. Bollinger Bands are most effective when the price is moving within a well-defined range, as the bands can help traders identify potential opportunities to buy or sell near the upper or lower bands. In trending markets, Bollinger Bands may not be as reliable.
Yes, Bollinger Bands can be used for day trading. In fact, many day traders use Bollinger Bands to identify short-term price movements and potential trading opportunities. Day traders can look for price reversals or breakouts near the upper or lower bands as potential entry or exit points.
Bollinger Bands can help with risk management by providing traders with levels of support and resistance. Traders can set stop-loss orders near the upper or lower bands to limit their potential losses if the price moves against their position. Additionally, Bollinger Bands can help traders determine their profit targets by identifying potential areas of price resistance.
Yes, there are some limitations to using Bollinger Bands. Bollinger Bands are primarily a volatility indicator and may not work as well in trending markets. Traders should also be aware that Bollinger Bands can sometimes give false signals, especially in choppy or volatile market conditions. It is important to use Bollinger Bands in conjunction with other technical analysis tools and indicators to confirm potential trading opportunities.
Bollinger Bands are a technical analysis tool that consists of three lines: a simple moving average (SMA) line, an upper band line, and a lower band line. The upper and lower bands are located at a set number of standard deviations away from the SMA line. Traders use Bollinger Bands to determine the volatility and potential price reversals in a market. When the price hits the upper band, it may be a signal to sell, and when the price hits the lower band, it may be a signal to buy.
There is no specific time of day that is universally considered the best for using Bollinger Bands to buy or sell. The optimal timing for using Bollinger Bands depends on various factors such as the specific market being traded, the trading strategy being employed, and the trader’s individual preferences and risk tolerance. It is important to continuously analyze the market and adjust trading decisions accordingly.

Is it good to invest in H& Investing in H&M can be a profitable venture for those who are looking to diversify their portfolio and capitalize on the …
Read Article
Understanding the Centered Average: Definition and Application The concept of centered average is an important statistical measure used to summarize a …
Read Article
Exploring the Interior of One World Trade Center The One World Trade Center stands tall and proud in the heart of New York City, as a symbol of …
Read Article
Four benefits of implementing an ESOP in an organization If you’re a business owner or executive looking for innovative ways to attract and retain top …
Read Article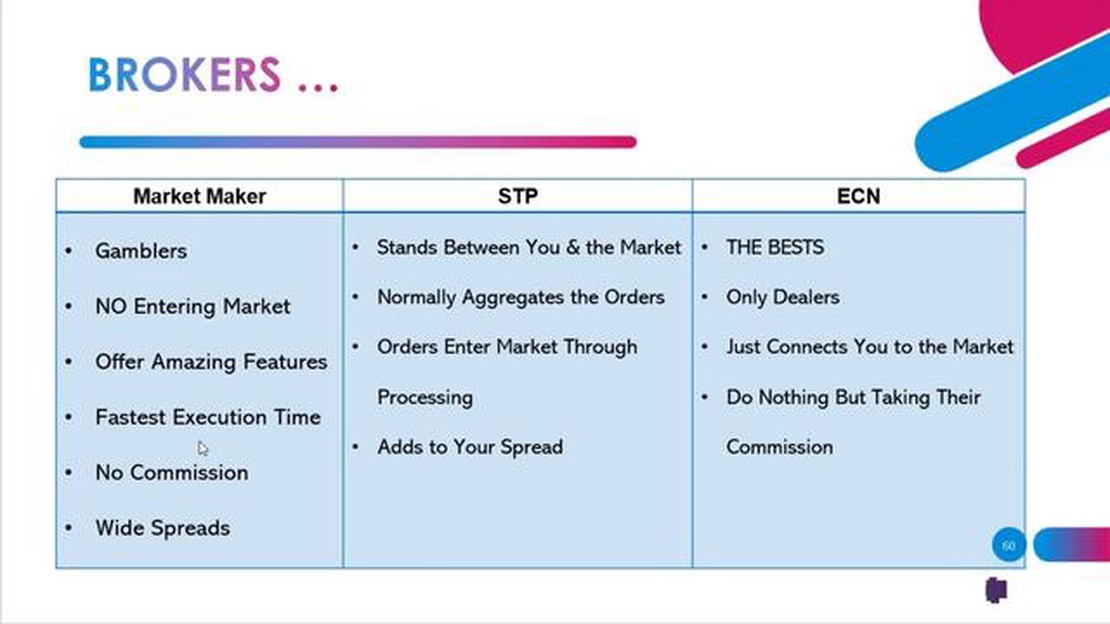
Is ECN better than market maker? Choosing the right type of broker is an important decision for any trader. Two popular options in the market are …
Read Article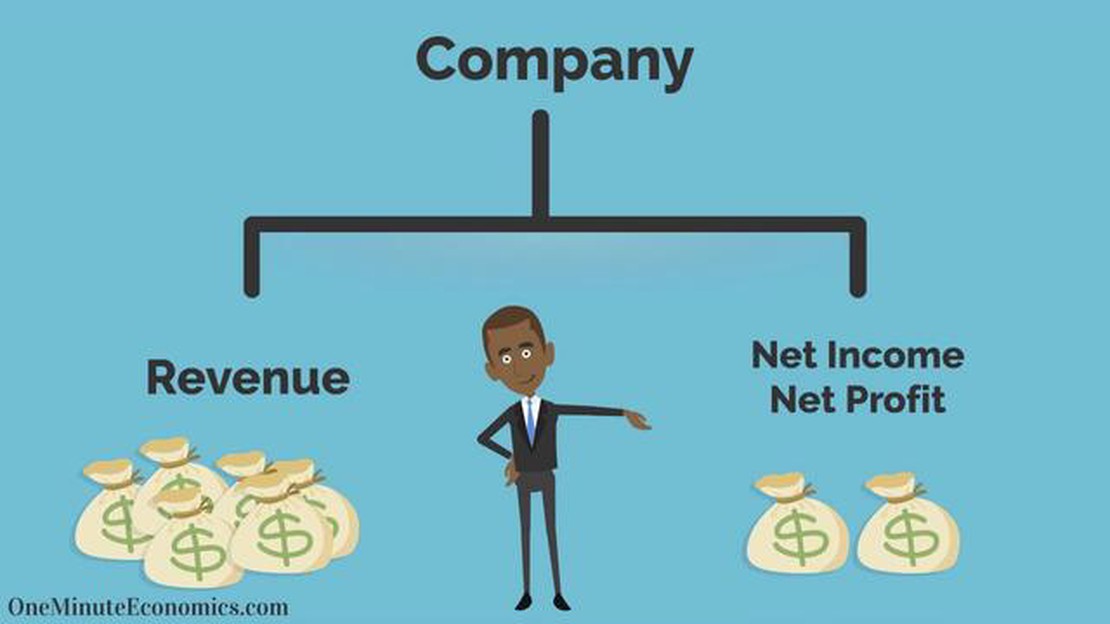
Example of a 50% Margin Margin is a financial term that refers to the difference between a product’s selling price and its cost of production. It is a …
Read Article


