


Is Forex Trading a Skill or Gambling? Exploring the Debate
Is Forex Trading a skill or gambling? The question of whether forex trading is a skill or a form of gambling has sparked heated debates among traders …
Read Article

The Relative Strength Index (RSI) combined with Moving Average (MA) is a highly effective trading strategy that can help traders identify potential entry and exit points in the market. This comprehensive guide will provide a detailed explanation of the RSI and MA indicators, as well as how to effectively use them together to make informed trading decisions.
The RSI is a technical momentum indicator that measures the strength and speed of a price movement. It oscillates between 0 and 100, with readings above 70 typically indicating overbought conditions and readings below 30 indicating oversold conditions. By using the RSI, traders can identify potential trend reversals and trading opportunities.
The Moving Average is a widely used trend-following indicator that smooths out price data over a specified period of time. It helps traders identify the direction of the trend and filter out short-term price fluctuations. By combining the RSI with the MA, traders can strengthen their trading signals and increase the probability of making profitable trades.
This guide will cover various aspects of the RSI with MA strategy, including how to set up the indicators on a chart, how to interpret the signals generated by the strategy, and how to manage risk and set appropriate stop-loss levels. Additionally, it will provide real-life examples and practical tips to help traders apply this strategy effectively in different market conditions.
Whether you are a novice trader looking to enhance your trading skills or an experienced trader seeking to refine your trading strategy, understanding the RSI with MA strategy is essential. This comprehensive guide will equip you with the knowledge and tools needed to effectively use these powerful indicators and improve your trading performance.
The Relative Strength Index (RSI) is a popular momentum oscillator that measures the speed and change of price movements. It oscillates between 0 and 100 and is used to identify overbought and oversold levels in an asset. A reading above 70 is typically considered overbought, while a reading below 30 is typically considered oversold.
Moving Averages (MA) are trend indicators that help smooth out price data over a specified period of time. They provide valuable insights into the overall direction of a market. The two most commonly used moving averages are the Simple Moving Average (SMA) and the Exponential Moving Average (EMA).
The RSI with MA strategy combines the RSI indicator with a moving average to generate trading signals. When the RSI crosses above a specified level (e.g., 30 or 40), it is considered a bullish signal. Conversely, when the RSI crosses below a specified level (e.g., 70 or 60), it is considered a bearish signal. The moving average is used to confirm the overall trend and avoid false signals.
Traders can use the RSI with MA strategy in various ways. Some traders use it to generate buy and sell signals, while others use it as a filter to confirm signals from other technical indicators or trading systems. It is important to note that this strategy is not foolproof and should be used in conjunction with other forms of analysis and risk management techniques.
In conclusion, the RSI with MA strategy combines the Relative Strength Index (RSI) and Moving Averages (MA) to identify potential trading opportunities. By combining momentum and trend indicators, this strategy aims to provide traders with a systematic approach to trading the financial markets.
The Relative Strength Index (RSI) is a popular technical analysis tool used by traders to measure the strength and momentum of a stock or other financial instrument. It is an oscillator that ranges from 0 to 100 and is typically used to identify overbought and oversold conditions in the market.
The RSI is based on the concept that price changes tend to happen in cycles, and that overextended price movements can lead to reversals. When the RSI is above the 70 level, it is considered overbought, indicating that the price may be due for a decline. Conversely, when the RSI is below the 30 level, it is considered oversold, suggesting that the price may be due for a rally.
The RSI is calculated using a formula that takes into account the average gains and losses over a specified period of time. The default period is typically 14, but can be adjusted based on the trader’s preferences and the timeframe being analyzed. The RSI can be calculated using either a simple or exponential moving average for the average gain and loss calculations.
Traders can use the RSI in a variety of ways to make trading decisions. Some common strategies include using the RSI to identify divergences between price and momentum, using it to confirm trend reversals, and using it to generate buy and sell signals when it crosses certain threshold levels.

It is important to note that like any technical indicator, the RSI is not infallible and should not be relied upon solely for making trading decisions. It is best used in conjunction with other technical and fundamental analysis tools to increase the probability of successful trades.
The Relative Strength Index (RSI) is a popular technical indicator used by traders to identify overbought or oversold conditions in the market. By combining the RSI with moving averages, traders can create a comprehensive strategy to detect potential trade opportunities.
Read Also: Is the Forex Market Open Tomorrow? Find Out Now
To use the RSI indicator with moving averages, follow these steps:
Step 1: Calculate the RSI
Start by calculating the RSI using the closing prices of the asset. The RSI is a momentum oscillator that ranges from 0 to 100. A reading above 70 is typically considered overbought, while a reading below 30 is considered oversold.
Step 2: Plot the Moving Averages
Next, plot two moving averages on the price chart. You can use any combination of moving averages, but a commonly used combination is the 50-day and 200-day moving averages. The shorter-term moving average reflects the short-term trend, while the longer-term moving average represents the overall trend.
Step 3: Identify the Crosses
Read Also: Understanding the Holy Grail in Forex Trading: Exploring Strategies for Success
Observe the crosses between the RSI and the moving averages. When the RSI crosses above the shorter-term moving average, it can indicate a bullish signal. Conversely, when the RSI crosses below the shorter-term moving average, it can indicate a bearish signal.
Step 4: Confirm with Price Action

Confirm the RSI and moving average crosses with price action. Look for support and resistance levels, chart patterns, and other technical indicators to validate your trading decision.
Step 5: Take Action
Once the RSI, moving averages, and price action are aligned, consider entering a trade. If the RSI crosses above the shorter-term moving average and the price is breaking out above a key resistance level, it could be a signal to go long. Conversely, if the RSI crosses below the shorter-term moving average and the price is breaking down below a key support level, it could be a signal to go short.
Remember, trading is inherently risky, and it’s important to manage your risk by setting stop-loss orders and practicing proper money management.
By combining the RSI indicator with moving averages, traders can gain a deeper understanding of market trends and potentially improve their trading decisions. However, it’s always recommended to test any strategy on a demo account before applying it to real trading.
The RSI with MA strategy is a trading strategy that combines the Relative Strength Index (RSI) indicator with Moving Averages (MA). It is used to identify potential buying or selling opportunities in the market.
The RSI with MA strategy works by using the RSI indicator to measure the strength of a security’s price movement, and the MA to identify the overall trend. When the RSI indicates that a security is overbought or oversold, and the MA confirms the trend, it can be a signal to enter or exit a trade.
The best time frame for using the RSI with MA strategy depends on the trader’s individual trading style and goals. It can be used on any time frame, from intraday charts to monthly charts. Traders may choose a shorter time frame for more frequent trading opportunities, or a longer time frame for more reliable signals.
Yes, the RSI with MA strategy can be used on any market, including stocks, forex, commodities, and cryptocurrencies. It is a versatile strategy that can be applied to a wide range of markets and time frames.
While the RSI with MA strategy can be effective in identifying potential trading opportunities, it is not foolproof. Like any trading strategy, it can produce false signals or lead to losses. Traders should always use proper risk management techniques and consider other factors, such as market conditions and news events, when making trading decisions.
The RSI with MA strategy combines the Relative Strength Index (RSI) and Moving Averages (MA) indicator to identify potential entry and exit points in a trading strategy. The RSI measures the magnitude of recent price changes to determine whether a security is overbought or oversold, while the MA calculates the average price over a specific period of time to determine the overall trend of the security. By combining these two indicators, traders can identify opportunities to buy or sell a security based on the RSI’s signal and the MA’s trend direction.
The RSI with MA strategy works by using the RSI indicator to identify overbought and oversold levels, and the MA indicator to determine the trend direction. When the RSI indicates that a security is overbought, it suggests a potential sell signal. Conversely, when the RSI indicates that a security is oversold, it suggests a potential buy signal. The MA indicator helps confirm the trend direction, with a rising MA indicating an uptrend and a declining MA indicating a downtrend. Traders can use these signals to enter or exit trades, depending on their trading strategy and risk tolerance.

Is Forex Trading a skill or gambling? The question of whether forex trading is a skill or a form of gambling has sparked heated debates among traders …
Read Article
Is it Possible to Make Profit in Forex Trading? Forex trading, also known as foreign exchange trading, offers the potential for lucrative financial …
Read Article
Calculating average in VB: a comprehensive guide Calculating the average of a set of numbers is a fundamental task in many programming languages, …
Read Article
MetaStock’s All Time High: A Look at its Record-breaking Performance MetaStock has carved a niche as one of the most powerful and versatile charting …
Read Article
Is TFSA good for day trading? TFSA (Tax-Free Savings Account) is a popular investment tool in Canada that offers tax-free growth and withdrawals. It …
Read Article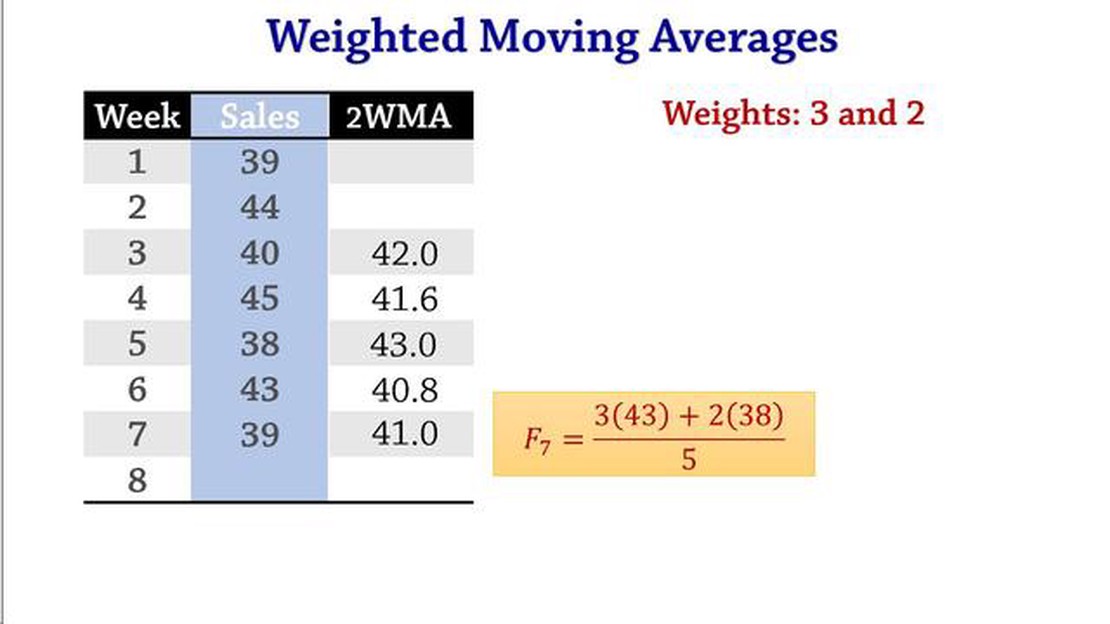
Advantages of Weighted Moving Average Method The weighted moving average method is a powerful tool used in data analysis and forecasting. This method …
Read Article


