


Is Auto Trading Legit? The Truth Revealed
Is Auto Trading Legit? Auto trading, also known as algorithmic trading or robotic trading, has gained a lot of attention in recent years. The idea of …
Read Article
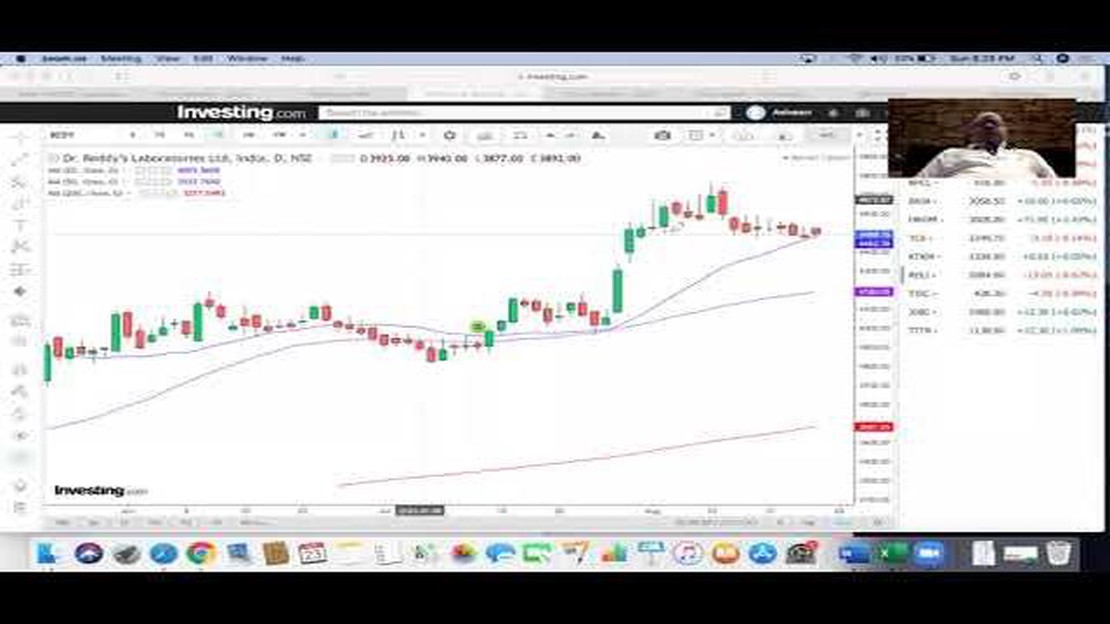
When it comes to evaluating the performance of the stock market, one important factor to consider is the percentage of stocks that are trading above their 20-day moving average. The 20-day moving average is a commonly used technical indicator that helps investors and traders identify trends in stock prices. It is calculated by taking the average closing price of a stock over the past 20 trading days.
By looking at the percentage of stocks that are trading above their 20-day moving average, investors can get a sense of whether the overall market is in an uptrend or a downtrend. If a high percentage of stocks are trading above their 20-day moving average, it suggests that the market is strong and there is broad participation among stocks. On the other hand, if a low percentage of stocks are trading above their 20-day moving average, it suggests that the market is weak and there is limited participation.
Trends in the percentage of stocks above their 20-day moving average can also provide valuable insights into market sentiment. For example, if the percentage of stocks above their 20-day moving average is increasing, it suggests that investors are becoming more bullish and are buying stocks. Conversely, if the percentage is decreasing, it suggests that investors are becoming more bearish and are selling stocks.
Overall, monitoring the percentage of stocks that are trading above their 20-day moving average can help investors make informed decisions about the overall market trend and sentiment. It serves as a valuable tool for understanding market dynamics and identifying potential opportunities or risks.
The percentage of stocks above their 20-day moving average is a technical analysis indicator that measures the breadth of market participation. It helps investors and traders assess the overall health of the stock market and determine the strength of the current trend.
This indicator calculates the percentage of stocks in a given market or index that are trading above their 20-day moving average. The moving average is a commonly used technical indicator that smoothes out price fluctuations over a specific period and provides a trend line. It is calculated by taking the average closing price of a stock over the past 20 trading days.
The percentage of stocks above 20-day is an important metric for investors and traders as it provides insights into the level of participation and trend strength in the market. When a large percentage of stocks are trading above their 20-day moving average, it suggests that the market is generally in an uptrend and that there is broad-based strength. On the other hand, a low percentage indicates weak market participation and a potential decline in the market.
This indicator can be used in various ways. For example, it can be used as a confirmation tool for other technical indicators, such as moving average crossovers or trend line breaks. If a moving average crossover signals a bullish trend reversal, the percentage of stocks above 20-day can be used to confirm the strength of the trend by checking if a significant number of stocks are trading above their moving averages.
Additionally, traders and investors can use this indicator to identify potential market reversals or overbought/oversold conditions. If the percentage of stocks above 20-day reaches an extreme level, such as above 80% or below 20%, it may indicate that the market is overextended and due for a correction or a reversal.
Overall, understanding the percentage of stocks above 20-day can provide valuable insights into market breadth and trend strength. It can help traders and investors make more informed decisions and enhance their overall trading strategies.

The term “stocks above 20 day” refers to the percentage of stocks that are currently trading above their 20-day moving average. The 20-day moving average is a commonly used technical indicator that helps investors and traders analyze the short-term trend of a stock or the overall market.
When a stock is trading above its 20-day moving average, it is considered to be in an uptrend or showing positive momentum. This indicates that the stock price has been consistently moving higher over the past 20 trading days. On the other hand, when a stock is trading below its 20-day moving average, it is considered to be in a downtrend or showing negative momentum. This suggests that the stock price has been consistently declining over the past 20 trading days.
The percentage of stocks that are above 20 day is an important metric in technical analysis as it provides insights into the overall market sentiment. When a high percentage of stocks are trading above their 20-day moving average, it is a sign that the overall market is bullish and investors are confident about the future prospects of the stocks. This can be an indication of a healthy and strong market.
Read Also: Why is K2 called K2? | Exploring the origin of K2 mountain's name
On the other hand, when a low percentage of stocks are trading above their 20-day moving average, it suggests that the overall market sentiment is bearish and investors are not as optimistic about the future prospects of the stocks. This can be an indication of a weak market or potential market downturn.
Traders and investors use the percentage of stocks above 20 day as a tool to make informed decisions about their trades and investments. By analyzing this metric, they can identify market trends and determine whether to adopt a bullish or bearish stance. It can also help them to identify potential buying or selling opportunities based on the overall market sentiment.
In conclusion, stocks above 20 day refers to the percentage of stocks trading above their 20-day moving average. This metric is important in technical analysis as it provides insights into the overall market sentiment and helps traders and investors make informed decisions about their trades and investments.
The percentage of stocks above 20-day moving average is influenced by several factors. Understanding these factors can help investors make informed decisions in the stock market.
Read Also: Understanding EFP in trading: A comprehensive guide
One major factor that affects the percentage of stocks above 20-day moving average is market sentiment. If the overall sentiment is positive, it is more likely that a higher percentage of stocks will be trading above their 20-day moving average. On the other hand, in a bearish market, the percentage of stocks above 20-day moving average is likely to be lower.
Another important factor is the trend in the broader market. If the market is in an uptrend, it is more likely that a larger percentage of stocks will be trading above their 20-day moving average. Conversely, in a downtrend, the percentage of stocks above 20-day moving average is likely to be lower.
Volatility in the market also plays a role in the percentage of stocks above 20-day moving average. Higher volatility can lead to larger price swings, which can cause stocks to move above or below their 20-day moving average more frequently. Therefore, during periods of high volatility, the percentage of stocks above 20-day moving average may be more variable.

Additionally, sector rotation can have an impact on the percentage of stocks above 20-day moving average. Different sectors of the market can perform differently at different times, and this can affect the overall percentage of stocks trading above their 20-day moving average. For example, if a particular sector is experiencing a strong upward trend, a larger percentage of stocks in that sector may be trading above their 20-day moving average.
Lastly, individual stock performance can also influence the percentage of stocks above 20-day moving average. Stocks with strong fundamentals and positive news may be more likely to trade above their 20-day moving average, while stocks with weak performance and negative news may be more likely to trade below their 20-day moving average.
In conclusion, the percentage of stocks above 20-day moving average is influenced by market sentiment, trend in the broader market, volatility, sector rotation, and individual stock performance. Considering these factors can help investors gain insights into market conditions and make better-informed decisions.
The 20-day mark is a commonly used indicator by traders and investors to measure short-term momentum in stocks. If a high percentage of stocks are above the 20-day mark, it suggests that the market is in an uptrend and there is bullish momentum present.
As of the latest data, the percentage of stocks above the 20-day mark is approximately 75%. This indicates that there is a strong bullish sentiment in the market.
The percentage of stocks above the 20-day mark can be used as a gauge for the overall health of the market. If the percentage is high, it may indicate a bullish market and could influence investors to be more inclined to buy stocks. Conversely, a low percentage may signal a bearish market and could lead investors to consider selling or shorting stocks.
Some other commonly used indicators to measure stock momentum include the 50-day moving average, the relative strength index (RSI), and the MACD (moving average convergence divergence). These indicators can provide additional insight into the overall trend and strength of a stock.
While the percentage of stocks above the 20-day mark can be a useful indicator, it should not be the sole basis for making investment decisions. It is important to consider other factors such as fundamental analysis, market conditions, and individual stock performance. Additionally, market trends can change quickly, so it is important to regularly reassess and validate any indicators being used.

Is Auto Trading Legit? Auto trading, also known as algorithmic trading or robotic trading, has gained a lot of attention in recent years. The idea of …
Read Article
Understanding the Mechanics of Selling Stock Options Selling stock options can be a complex process that requires a deep understanding of the …
Read Article
Best Gold Trading Strategies for Forex Gold has always been a symbol of wealth, power, and stability. Its value has remained relatively stable over …
Read Article
Reporting Sale of Non-Qualified Stock Options When it comes to stock options, there are different types of options that can be granted to employees. …
Read Article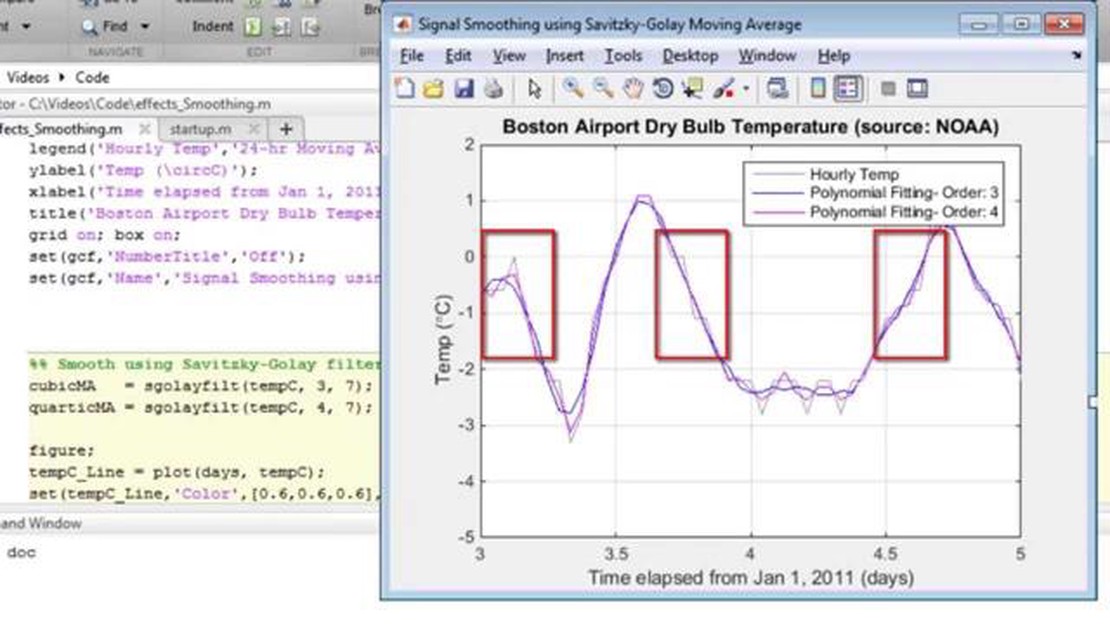
Understanding the Difference between Moving Average and Savitzky-Golay Filter In the field of signal processing, there are various methods used for …
Read Article
Are Bollinger Bands Effective in Technical Analysis? Bollinger Bands are a popular technical analysis tool used by traders to identify potential price …
Read Article


