

Understanding ETS: The Comprehensive Guide to Emission Trading Systems
Understanding ETS: Exploring Its Functionality and Operation Emission Trading Systems (ETS) have become a key tool in the global effort to combat …
Read Article
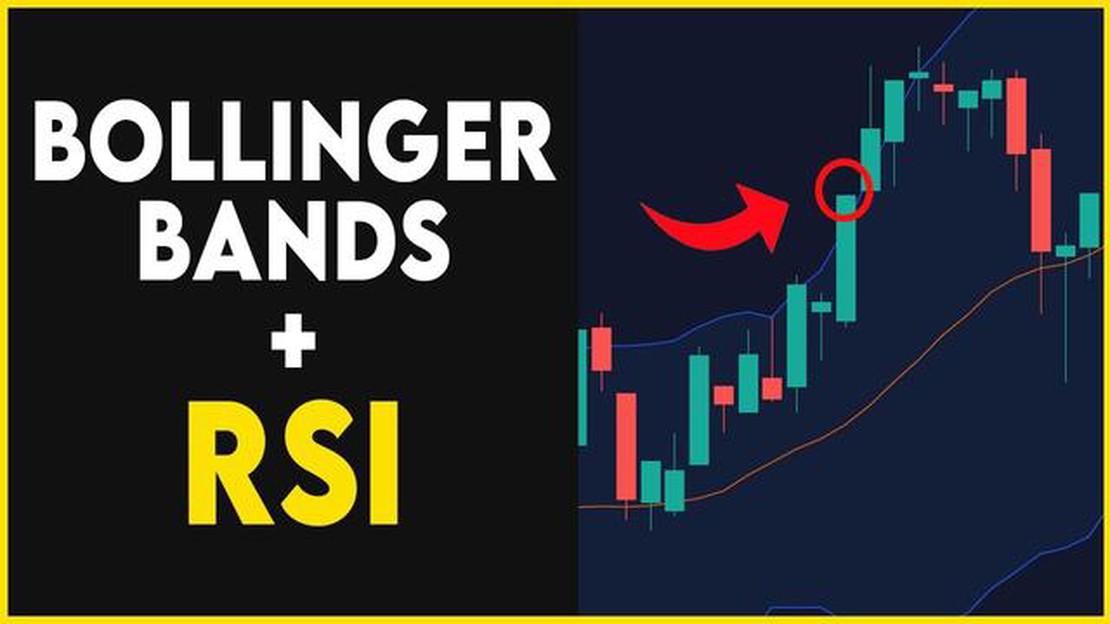
Bollinger Bands are a popular technical analysis tool used by traders to identify potential price reversals and volatility in financial markets. Developed by John Bollinger in the 1980s, this indicator consists of a simple moving average line and two standard deviation lines that envelop the price chart. The upper and lower bands dynamically adjust to market conditions, reflecting changes in volatility. Many traders rely on Bollinger Bands to help them make informed trading decisions.
One of the main benefits of using Bollinger Bands is their ability to provide a visual representation of market volatility. The width of the bands expands and contracts as volatility increases or decreases, giving traders a clear indication of market conditions. When the bands are narrow, it suggests that the market is ranging or consolidating, while wider bands indicate higher volatility and potential trading opportunities.
In addition to identifying volatility, Bollinger Bands can also be used to spot potential price reversals. When the price touches or crosses the upper band, it may be a signal that the market is overbought and due for a downward correction. Conversely, when the price touches or crosses the lower band, it may indicate an oversold condition and a potential upward reversal. Traders often wait for confirmation signals, such as candlestick patterns or other technical indicators, before making a trade based on Bollinger Bands.
However, it is important to note that Bollinger Bands are not infallible and should be used in conjunction with other indicators and analysis methods. Like any technical tool, they have their limitations and may produce false signals in certain market conditions. It is crucial for traders to develop a comprehensive trading plan and not rely solely on Bollinger Bands for trading decisions. Nevertheless, when used correctly, Bollinger Bands can be a valuable tool in a trader’s arsenal, assisting them in identifying potential trading opportunities and managing risk.

Bollinger Bands are a popular technical analysis tool developed by John Bollinger in the 1980s. They consist of three lines that are plotted on a price chart using standard deviation calculations. The three lines are the upper Bollinger Band, the middle Bollinger Band, and the lower Bollinger Band.
The middle Bollinger Band is a simple moving average, typically calculated using a 20-day period. The upper Bollinger Band is calculated by adding two standard deviations to the middle band, while the lower Bollinger Band is calculated by subtracting two standard deviations from the middle band.
The purpose of Bollinger Bands is to provide a visual representation of price volatility. When the price is experiencing high volatility, the bands expand, and when the price is experiencing low volatility, the bands contract. Traders use Bollinger Bands to identify potential entry and exit points in the market.
One common trading strategy involving Bollinger Bands is to buy when the price touches the lower band and sell when the price touches the upper band. This strategy assumes that the price will revert back to the middle band after touching one of the outer bands.
It is important to note that Bollinger Bands should not be used as a standalone tool for making trading decisions. They are most effective when used in conjunction with other technical indicators and chart patterns to confirm trading signals.
Read Also: Discovering the Enigmatic Simon Goh: A Journey into the Life and Achievements of a Remarkable Individual
Bollinger Bands are a technical analysis tool developed by John Bollinger in the 1980s. They are used to analyze the volatility and potential price movements of an asset. Bollinger Bands consist of a middle band, which is a simple moving average (SMA), and an upper and lower band, which represent the standard deviation of the asset’s price from the middle band.
The middle band is usually set to a 20-day SMA, although different time periods can be used depending on the trader’s preference. The upper and lower bands are typically set two standard deviations away from the middle band. When the price of the asset moves towards the upper band, it is considered overbought, while moves towards the lower band indicate oversold conditions. These bands provide traders with potential buy or sell signals.
The width of the Bollinger Bands is another important factor to consider. When the bands are narrow, it indicates low volatility, while wider bands suggest higher volatility. Traders often use Bollinger Bands in combination with other technical indicators to confirm trading signals.
One popular strategy that utilizes Bollinger Bands is the Bollinger Squeeze. When the bands contract and narrow, it suggests that a period of low volatility is about to be followed by a period of high volatility. Traders using this strategy will wait for a breakout from the bands and enter a position in the direction of the breakout.
Read Also: Understanding the Moving Average of an Interval: A Comprehensive Guide
While Bollinger Bands can be a useful tool for traders, it is important to note that they are not foolproof. Whipsaw moves, where prices quickly move in and out of the bands, can occur, leading to false signals. Additionally, Bollinger Bands should be used in conjunction with other technical analysis tools and should not be relied on as the sole indicator for making trading decisions.
In conclusion, Bollinger Bands provide traders with important information about the volatility of an asset and can help identify potential buy or sell signals. However, they should be used in conjunction with other technical indicators and should not be the sole basis for trading decisions.
Note: This article is for informational purposes only and should not be construed as financial advice. Always do your own research and consult with a qualified financial advisor before making any investment decisions.
Bollinger Bands are a technical analysis tool that consists of a middle band, an upper band, and a lower band. The middle band is typically a simple moving average, while the upper and lower bands are calculated based on the standard deviation of the price. The bands expand and contract based on market volatility, and they are used to identify potential entry and exit points in trading.
Bollinger Bands are not specifically designed to predict market trends. They are primarily used as a volatility indicator and a tool for identifying potential overbought or oversold conditions. Although they can provide some insights into market behavior, it is important to use them in conjunction with other technical analysis tools and indicators for a more comprehensive analysis.

Yes, Bollinger Bands can be used for day trading. Traders often use Bollinger Bands to identify potential breakouts or breakdowns in price. When the price moves above the upper band, it may indicate a potential bullish breakout, while a move below the lower band may suggest a potential bearish breakdown. Traders can use these signals as a basis for their trading decisions, but it is important to consider other factors and confirm the signals with additional analysis.
Bollinger Bands can be used by beginners, but it is important to have a solid understanding of technical analysis and trading principles. Beginners should take the time to learn how Bollinger Bands work, how to interpret their signals, and how to use them in conjunction with other indicators. It is also recommended to practice trading with Bollinger Bands in a demo account or with a small amount of capital before risking larger amounts of money in the markets.
Bollinger Bands can be effective in various market conditions, but they may work better in certain situations. They are particularly useful in volatile markets, as the bands tend to expand when volatility increases, providing potentially more reliable trading signals. In low volatility markets, the bands may contract, making it harder to identify significant price movements. However, it is important to adapt and use other technical analysis tools in conjunction with Bollinger Bands to account for different market conditions.

Understanding ETS: Exploring Its Functionality and Operation Emission Trading Systems (ETS) have become a key tool in the global effort to combat …
Read Article
Optimizing your computer setup for day trading When it comes to day trading, having the right tools is crucial to success. One of the most important …
Read Article
Connecting to FXCM API: A Comprehensive Guide FXCM (Forex Capital Markets) is a leading provider of online foreign exchange (forex) trading, CFD …
Read Article
Understanding Lmax Trading: A Comprehensive Guide In today’s fast-paced trading world, it is crucial for traders to have access to advanced …
Read Article
Understanding Emissions Trading and its Benefits Emissions trading, also known as cap and trade, is a market-based approach to reduce greenhouse gas …
Read Article
Calculating the average of a matrix in Matlab Matlab is a powerful programming language and software environment used for numerical computation and …
Read Article


