


How Much Does It Cost to Start Options Trading? | A Breakdown of Costs and Investments
Cost of Starting Options Trading Options trading can be an exciting and potentially lucrative venture, but it’s important to consider the costs …
Read Article
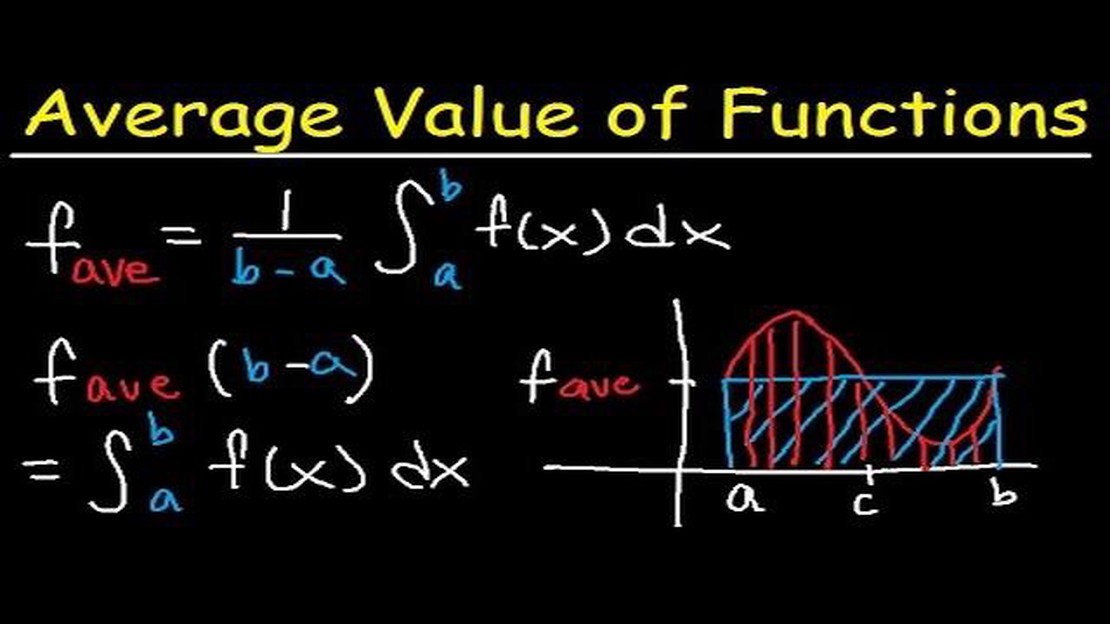
When it comes to analyzing data and making predictions, the moving average of an interval is an invaluable tool. Whether you are a stock market investor, a financial analyst, or a data scientist, understanding how to calculate and interpret moving averages can provide you with valuable insights into trends and patterns.
A moving average is a statistical calculation that is used to analyze a set of data points over a specific period of time. It is called a “moving” average because it is constantly updated as new data points become available. By using a moving average, you can smooth out fluctuations in the data and identify long-term trends.
The moving average is calculated by adding up the values of all the data points in the interval and then dividing that sum by the number of data points in the interval. For example, if you are calculating a 7-day moving average for a stock price, you would add up the prices of the stock for the past 7 days and then divide that sum by 7. This calculation gives you the average price of the stock over a 7-day period.
Once you have calculated the moving average, you can use it to identify trends and make predictions. If the moving average is increasing, it suggests that the data points are trending upward and vice versa. By comparing the moving average to the actual data points, you can also identify periods of time when the data deviate significantly from the average, which could indicate a change in the trend.
In conclusion, understanding the moving average of an interval is essential for anyone working with data analysis and prediction. By calculating and interpreting moving averages, you can gain valuable insights into trends and patterns that can inform your decision-making process. Whether you are a seasoned investor or just starting out in the world of data analysis, the moving average is a tool that you can’t afford to overlook.
The moving average is a statistical calculation used to analyze data over a certain period of time and smooth out fluctuations or random variations. It is commonly used in finance, economics, and other fields to analyze trends and predict future values.
The moving average is calculated by taking the average of a set of data points within a given interval. The interval can be any time period, such as days, weeks, months, or years, depending on the type of data being analyzed and the desired level of detail.
For example, if we have a set of stock prices over the past 10 days, we can calculate a 5-day moving average by taking the average of the prices for the past 5 days. This moving average will provide a smoother trend line compared to the individual daily prices, allowing us to identify broader patterns and trends.
The moving average is a useful tool for smoothing out noisy or volatile data and identifying long-term trends. It helps to filter out short-term fluctuations and highlight the underlying direction or pattern of the data.
The moving average can also be used to identify support and resistance levels in financial markets. When the price of an asset crosses above its moving average, it is often considered a bullish signal, indicating a potential uptrend. Conversely, when the price crosses below its moving average, it is seen as a bearish signal, indicating a potential downtrend.
Overall, the moving average is a versatile and widely used statistical tool that helps to analyze data and identify trends. It enables analysts and researchers to make more informed decisions and predictions based on the underlying patterns of the data.

The moving average is a commonly used statistical indicator that helps smooth out the noise in time series data and identify trends. It is widely used in various fields like finance, economics, and weather forecasting. To calculate the moving average, a specific number of data points, known as the “interval,” are taken and averaged to provide a moving average value at a particular point in time.
The moving average formula can be defined as:
Read Also: Discovering the Main Forex Currency in London: Essential Guide
MA = (X1 + X2 + X3 + … + Xn) / n
Where:
For example, let’s consider a simple scenario where we have a time series of 10 data points. If we want to calculate the 5-day moving average, we would take the sum of the last 5 data points and divide it by 5. Then, we would shift the interval one day forward and repeat the process to calculate the moving average for the next day. This process continues for all the data points in the time series.
The moving average formula essentially calculates the average value of the data points within the specified interval. By using this average value, the moving average helps to minimize the impact of random fluctuations in the data and provides a smoother representation of the underlying trend.
It is important to note that the choice of the interval for calculating the moving average can greatly impact the results. A shorter interval will provide a more sensitive moving average that quickly adapts to the changes in the data. On the other hand, a longer interval will provide a smoother moving average but may lag behind the trend changes.
In conclusion, understanding the moving average formula is crucial for utilizing this statistical indicator effectively. By calculating the average value of a specific interval, the moving average helps identify trends and filter out noise in time series data, making it a valuable tool in various industries.
Read Also: Learn about the trending and ranging indicator in financial markets
Calculating the moving average is a straightforward process that involves taking the sum of a specified number of data points within a given interval and dividing it by the number of data points. This results in the average value for that interval.
To calculate the moving average, follow these steps:

Step 1: Determine the interval over which you want to calculate the moving average. This could be a fixed number of data points, such as the past 7 days, or a variable interval based on time periods, such as the past month.
Step 2: Identify the data points within the chosen interval. These data points should be continuous and not skip any points within the interval.
Step 3: Sum up the identified data points to obtain the total.
Step 4: Divide the total obtained in Step 3 by the number of data points in the interval. This will give you the moving average for that interval.
For example, let’s say you want to calculate the 7-day moving average of daily temperatures. The past 7 days’ temperature readings are as follows: 68, 71, 73, 69, 72, 70, and 67. To calculate the moving average, add up these temperatures (68 + 71 + 73 + 69 + 72 + 70 + 67 = 490) and divide by 7 (the number of data points in the interval). The moving average would be 70.
Calculating the moving average helps to smooth out the fluctuations in data and provides a clearer trend over time. It is widely used in finance, stock market analysis, and technical analysis to identify patterns and make informed decisions.
A moving average is a statistical calculation used to analyze data points over a certain period of time by creating a series of averages. It is commonly used in technical analysis to identify trends and patterns in financial markets.
A moving average is calculated by taking the average of a specific number of data points over a given interval. The interval can be a fixed number of time periods or a variable range defined by specific conditions. The average is then recalculated as new data points become available, creating a moving average that helps smooth out fluctuations in the data.
There are several types of moving averages, including the simple moving average (SMA), exponential moving average (EMA), weighted moving average (WMA), and adaptive moving average (AMA). Each type has its own calculation method and characteristics, making them suitable for different analysis purposes.
The moving average is important in technical analysis because it helps identify trends and reversals in financial markets. It smoothes out short-term fluctuations in the data, allowing traders and analysts to focus on the overall direction of the market. By comparing different moving averages, traders can also derive trading signals and develop strategies based on the crossovers and divergences of these averages.

Cost of Starting Options Trading Options trading can be an exciting and potentially lucrative venture, but it’s important to consider the costs …
Read Article
Is there a desktop app for OANDA? When it comes to forex trading, having a reliable and efficient platform is crucial. Many traders prefer to use …
Read Article
Is ESOP beneficial or detrimental to shareholders? Employee Stock Ownership Plans (ESOPs) have become increasingly popular among businesses as a means …
Read Article
Buying Foreign Currency from ASB Bank: Everything You Need to Know If you’re planning to travel abroad or engage in international business, you may …
Read Article
Is there a foolproof winning strategy in forex? Forex trading, also known as foreign exchange trading, is a highly volatile and unpredictable market. …
Read Article
Is Forex Trading not gambling? Forex trading, also known as foreign exchange trading, is an activity that involves buying and selling currencies. …
Read Article

