

Easy steps to download historical data from MT5
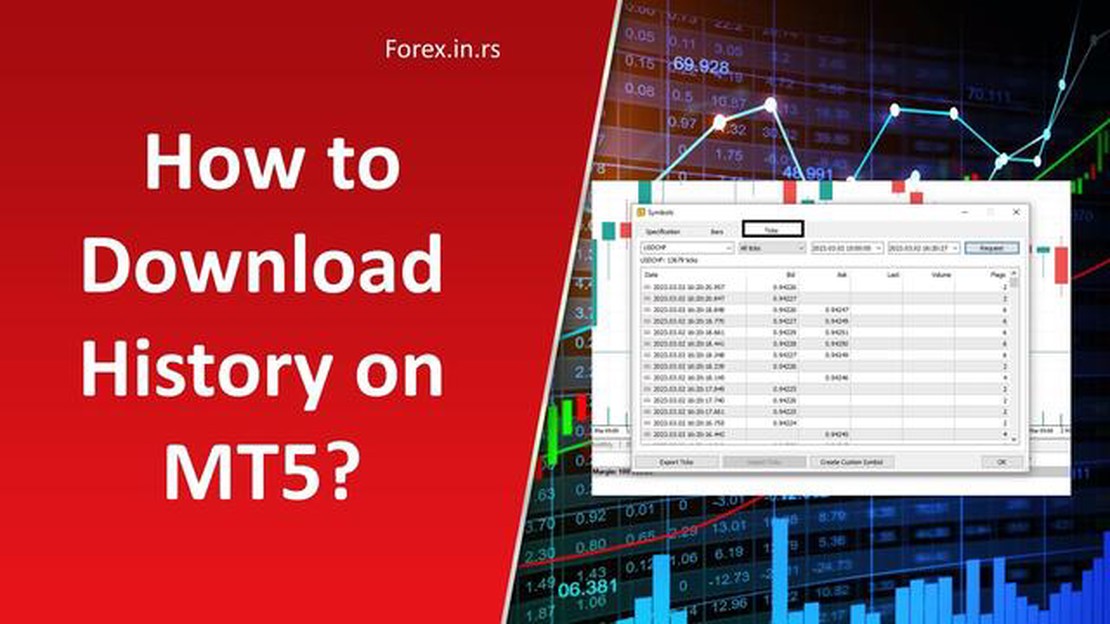
How to Download Historical Data from MT5 MetaTrader 5 (MT5) is a popular trading platform that allows traders to access financial markets and execute …
Read Article
The Relative Strength Index (RSI) is a popular technical indicator used in stock trading and other financial markets. It measures the speed and change of price movements and helps traders identify overbought and oversold conditions. The RSI is a range-bound oscillator that fluctuates between 0 and 100. Traders often wonder what is the recommended range for the RSI and how to interpret its values.
Typically, the RSI is considered overbought when its value exceeds 70, indicating that the asset may be due for a price correction or reversal. On the other hand, an RSI below 30 is often interpreted as oversold, suggesting that the asset may be undervalued and could experience a price rebound. These levels are known as the upper and lower thresholds and are frequently used by traders to make buy and sell decisions.
It’s important to note that the recommended range for the RSI may vary depending on the market conditions and the specific asset being analyzed. In highly volatile markets, traders may use higher thresholds, such as 80 for overbought and 20 for oversold, to filter out false signals. Conversely, in less volatile markets, lower thresholds, like 60 for overbought and 40 for oversold, may be more appropriate to prevent premature actions.
It’s worth mentioning that while the RSI is a useful tool for identifying potential trading opportunities, it should always be used in conjunction with other technical analysis indicators and risk management strategies. Traders should never rely solely on the RSI as a standalone indicator for making trading decisions.
In conclusion, the recommended range for the RSI is generally considered to be above 70 for overbought and below 30 for oversold. However, traders should adjust these thresholds based on the specific market conditions and volatility, as well as consider additional analysis tools. By using the RSI alongside other indicators, traders can gain a better understanding of the market and make more informed trading decisions.
The Relative Strength Index (RSI) is a popular technical indicator used to measure the strength and momentum of a financial asset’s price movements. It is calculated using a formula that compares the average gain and average loss over a specified period of time. The RSI ranges from 0 to 100 and is typically plotted as a line graph.
While there isn’t an exact ideal range for the RSI, traders often use certain levels as indications of potential overbought or oversold conditions in the market. The most commonly used range is from 30 to 70.

When the RSI falls below 30, it is considered oversold, suggesting that the asset may be undervalued and due for a potential price increase. Traders may interpret this as a buying opportunity.
Conversely, when the RSI rises above 70, it is considered overbought, indicating that the asset may be overvalued and due for a potential price decrease. Traders may interpret this as a selling opportunity.
It’s important to note that the RSI should not be used in isolation, but rather in conjunction with other technical indicators and analysis tools. Additionally, the ideal range for the RSI may vary depending on the specific market and timeframe being analyzed.
Read Also: Understanding the T-line in trading: Key concepts and strategies
Overall, the ideal range for the RSI can serve as a helpful tool for traders to identify potential market reversals and make more informed trading decisions.
The Relative Strength Index (RSI) is a technical indicator used in analyzing the strength and weakness of a financial instrument. It measures the magnitude and velocity of price movements to identify overbought and oversold conditions. One of the key aspects of using the RSI effectively is understanding and applying the recommended range.
The recommended range for the RSI is typically between 30 and 70. When the RSI value is above 70, it indicates that the instrument is overbought, meaning the price has risen too far and may be due for a decline. Conversely, when the RSI value is below 30, it indicates that the instrument is oversold, suggesting that the price has fallen too far and may be due for a rebound.
By paying attention to the RSI range, traders and investors can gain insights into potential market reversals and make more informed decisions. It helps to identify when an instrument is reaching extreme levels of buying or selling pressure, which can be valuable for timing entry and exit points for trades.
However, it’s important to note that the RSI range is not a foolproof indicator, and it should be used in conjunction with other technical analysis tools and fundamental analysis. The RSI is most effective when used in trending markets, and it may provide false signals in ranging or choppy markets.
In conclusion, understanding and applying the recommended range for the RSI is crucial in using this technical indicator effectively. By monitoring the RSI levels and interpreting them in the context of current market conditions, traders and investors can make more informed trading decisions and improve their overall profitability.
The Relative Strength Index (RSI) is a commonly used technical indicator that measures the strength and speed of price movements in a financial instrument. It is widely used by traders and analysts to identify overbought and oversold levels in the market and to generate trading signals.
The RSI is calculated based on the average gains and losses over a specified period of time. The RSI value ranges from 0 to 100, with values above 70 typically indicating overbought conditions and values below 30 indicating oversold conditions.
Read Also: Understanding the Concept of Foreign Exchange Fluctuation Account
However, there is no universally accepted optimal range for the RSI. The optimal range can vary depending on the market conditions and the specific financial instrument being analyzed. Some traders may prefer a narrower range, such as 60 to 40, while others may use a wider range, such as 80 to 20. It is important for traders to experiment and find the range that works best for their trading strategy and risk tolerance.
Traders should also be aware that the RSI is just one tool among many that can be used to analyze markets. It should be used in conjunction with other technical indicators and analysis methods to make well-informed trading decisions. It is also important to consider other factors such as market trends, support and resistance levels, and fundamental analysis when using the RSI.
In conclusion, determining the optimal RSI range requires experimentation and an understanding of market conditions and the specific financial instrument being analyzed. Traders should use the RSI in conjunction with other technical indicators and analysis methods to make informed trading decisions.

RSI stands for Relative Strength Index. It is an important technical indicator used by traders to analyze the overbought or oversold conditions of a particular asset. It helps traders to determine the momentum and potential reversals in the price of an asset.
The RSI ranges from 0 to 100. Traditionally, a value below 30 is considered oversold, indicating a potential upward reversal, while a value above 70 is considered overbought, indicating a potential downward reversal. However, some traders may use different ranges based on their trading strategies.
If the RSI goes below 30, it suggests that the asset is oversold and there might be a potential upward reversal in price. Traders may interpret this as a buying opportunity and consider entering a long position.
Yes, it is possible for an asset to stay in the overbought or oversold range for an extended period, especially during strong trending markets. Traders should use other indicators or analysis techniques to further confirm their trading decisions.
While RSI is a useful indicator, it is not recommended to use it as the sole basis for making trading decisions. Traders should consider using it in conjunction with other indicators and analysis tools to get a more comprehensive view of the market.

How to Download Historical Data from MT5 MetaTrader 5 (MT5) is a popular trading platform that allows traders to access financial markets and execute …
Read Article
Guide to Buying FBM KLCI Welcome to our comprehensive guide on how to buy FBM KLCI! The FBM KLCI is the main stock market index in Malaysia, …
Read Article
How to Create an AI Trading Bot: Step-by-Step Guide Artificial Intelligence (AI) has revolutionized many industries, and the world of trading is no …
Read Article
Top Trends in Forex Trading Are you interested in exploring the exciting world of Forex trading? Look no further! [Your Website Name] is here to …
Read Article
Understanding the Weekly Moving Average Concept The weekly moving average is a popular technical analysis tool used by traders and investors to …
Read Article
Is Forex Hedging Allowed in the US? Forex hedging is a risk management strategy that is commonly used by traders to protect themselves against …
Read Article


