
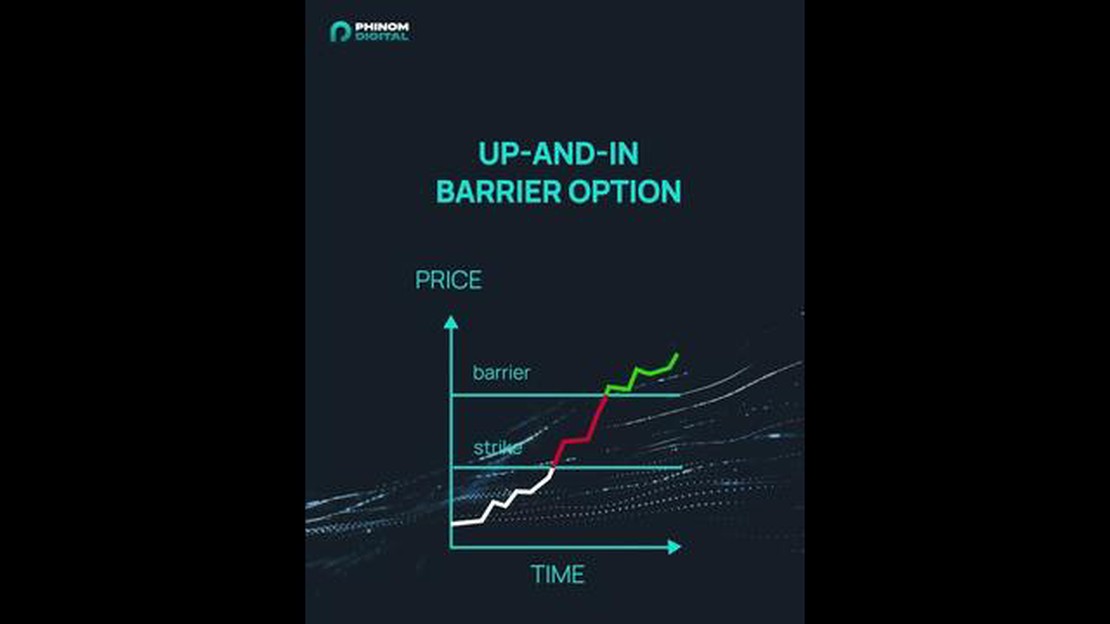

What is a Knock-In Option on FX? - Explained in Detail
Understanding Knock-In Options on FX A knock-in option on the foreign exchange market (FX) is a type of derivative that only becomes active or …
Read Article
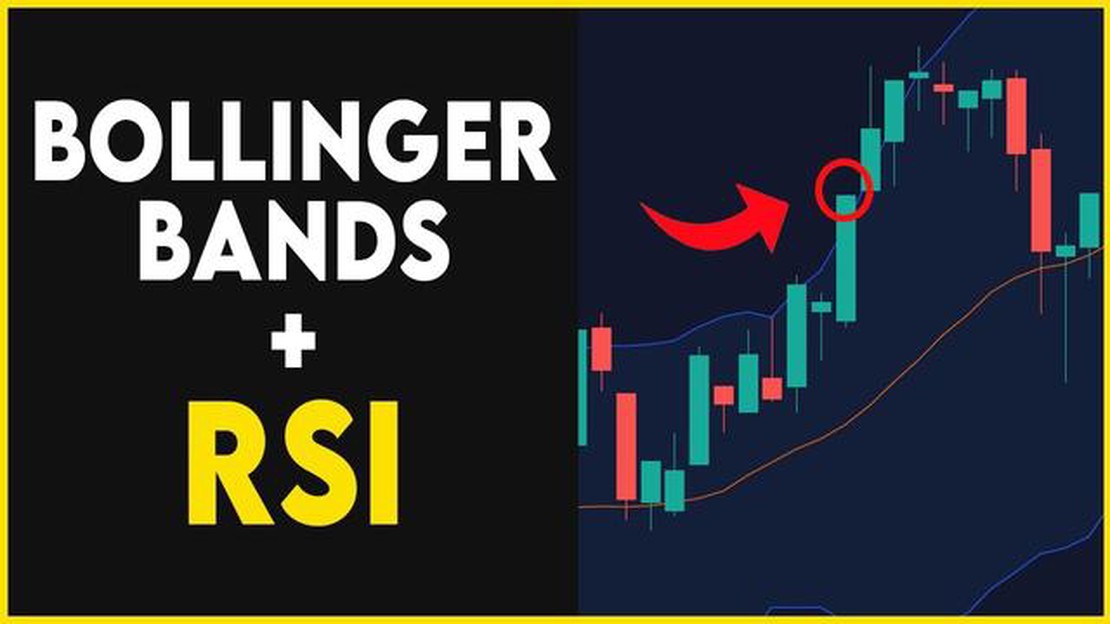
When it comes to technical analysis, Bollinger Bands have become one of the most popular and widely used indicators. They provide valuable information about volatility and can help traders identify potential price breakouts and trend reversals. However, in order to maximize the effectiveness of Bollinger Bands, it is crucial to choose the right time frame.
The time frame you choose will depend on your trading style and goals. If you are a day trader or a scalper, you may prefer shorter time frames such as 1-minute or 5-minute charts. On the other hand, if you are a swing trader or a position trader, you may opt for longer time frames such as daily or weekly charts.
It is important to note that different time frames will provide different signals and insights. Longer time frames tend to provide more reliable and accurate signals, as they filter out noise and random price fluctuations. However, they may also result in fewer trading opportunities.
On the other hand, shorter time frames may provide more trading opportunities, but the signals they generate may be less reliable and more prone to false breakouts. Therefore, it is essential to find the right balance between the trading opportunities and the accuracy of the signals.
Ultimately, choosing the right time frame for Bollinger Bands is a matter of finding what works best for your trading style and goals. It may require some experimentation and fine-tuning, but with practice and experience, you will be able to determine the optimal time frame that maximizes the effectiveness of Bollinger Bands in your trading strategy.
Remember, Bollinger Bands are just one tool in your technical analysis toolbox. It is important to use them in conjunction with other indicators and analysis techniques to make well-informed trading decisions.
Bollinger Bands are a popular technical analysis tool that helps traders analyze price volatility and identify potential trading opportunities. Developed by John Bollinger in the 1980s, Bollinger Bands consist of three lines plotted on a price chart: the middle band, the upper band, and the lower band.
The middle band is a simple moving average, typically set to a 20-day period, and represents the average price over the selected time frame. The upper band is calculated by adding two standard deviations to the middle band, while the lower band is calculated by subtracting two standard deviations from the middle band.
The width of the Bollinger Bands is determined by the volatility of the underlying market. When the market is highly volatile, the bands widen, indicating increased price movements. Conversely, when the market is less volatile, the bands contract, suggesting decreased price movements.
Bollinger Bands can be used in various ways to assist with trading decisions. One common approach is to look for price reversals when the price touches or crosses one of the bands. When the price reaches the upper band, it may indicate an overbought condition and a potential drop in price. Conversely, when the price touches the lower band, it may indicate an oversold condition and a possible upward price movement.
Another use of Bollinger Bands is to identify the beginning and end of trend movements. When the price is trending upward, it often stays close to or above the middle band, with the upper band acting as a resistance level. On the other hand, when the price is trending downward, it tends to stay close to or below the middle band, with the lower band acting as a support level.

While Bollinger Bands are a valuable tool for technical analysis, it is important to remember that they should not be used in isolation. Traders should consider using other indicators and technical analysis tools to confirm signals and validate potential trading opportunities.
Read Also: What happens to my stock when the company gets acquired?
Bollinger Bands are a technical analysis tool that was developed by John Bollinger in the 1980s. They consist of a simple moving average (SMA) in the middle, with an upper band and a lower band that are based on the standard deviation of the price.
The purpose of Bollinger Bands is to provide a relative definition of high and low prices. They are used to identify when an asset is overbought or oversold, and to observe potential reversals or trend continuations.
The upper and lower bands are calculated using a specified number of standard deviations from the SMA. The most common number used is 2 standard deviations.
When the price moves towards the upper band, it is considered overbought. Conversely, when the price moves towards the lower band, it is considered oversold. These levels may indicate potential reversal points or market extremes.
Bollinger Bands can also be used to identify volatility in the market. When the bands are narrow, it suggests that the market is experiencing low volatility. Conversely, when the bands are wide, it suggests that the market is experiencing high volatility.
Traders and investors often use Bollinger Bands in conjunction with other technical analysis tools to make trading decisions. They can be applied to any financial instrument and any time frame, but it is important to select the right time frame that matches your trading strategy and objectives.
Bollinger Bands are a technical analysis tool that consists of two standard deviation lines and a simple moving average line. The standard deviation lines are plotted above and below the moving average line, creating a channel or “band” around the price action. The bands expand and contract based on the volatility of the market.
The middle line, or the simple moving average, represents the average price over a specific period of time. By default, this is typically set to a 20-day moving average. However, the period can be adjusted based on the trader’s preference and the market being analyzed.
Read Also: Ultimate Guide: How to Sell MT4 Indicators and Maximize Your Profit
The standard deviation lines are calculated from the middle line and represent a measure of price volatility. They are typically set to two standard deviations from the moving average. The upper band is calculated by adding two standard deviations to the middle line, while the lower band is calculated by subtracting two standard deviations from the middle line.

When the price is trading within the bands, it is considered to be within a normal range. However, when the price moves outside of the bands, it is seen as a signal of increased volatility or a potential trend reversal.
Bollinger Bands can be used in various ways to assist in trading decisions. Traders often look for price breaks above or below the bands as a signal of potential price continuation or reversal. Additionally, they can be used to identify overbought and oversold conditions when the price is trading near the upper or lower bands.
| Advantages of using Bollinger Bands | Disadvantages of using Bollinger Bands |
|---|---|
| - Provides a visual representation of price volatility | - Can generate false signals during periods of low volatility |
| - Helps identify potential trend reversals | - Should not be used as a standalone indicator |
| - Can be used in conjunction with other technical analysis tools | - May lag behind price action during rapid market movements |
In conclusion, Bollinger Bands are a popular technical analysis tool that can be used to analyze price volatility and identify potential trading opportunities. However, it is important to use them in conjunction with other indicators and consider market conditions to avoid false signals.
Bollinger Bands are a technical analysis tool that consists of a moving average line and two standard deviation lines that are plotted above and below the moving average. These bands help traders to identify potential overbought or oversold conditions in the market.
Bollinger Bands work by creating a dynamic envelope around the price action. The middle band is a simple moving average, typically 20 periods, and the upper and lower bands are calculated by adding and subtracting the standard deviation of price changes. When the price moves close to the upper band, it may be overbought, and when it moves close to the lower band, it may be oversold.
Choosing the right time frame for Bollinger Bands is important because different time frames capture different levels of price volatility. Shorter time frames, like 5 or 15 minutes, are better suited for intraday trading, while longer time frames, like daily or weekly, are more suitable for longer-term analysis. Traders need to consider their trading style and goals when selecting the time frame for Bollinger Bands.
Yes, Bollinger Bands can be used for any financial instrument, including stocks, commodities, forex, and cryptocurrencies. The key is to adapt the parameters of the Bollinger Bands, such as the time frame and standard deviation, to the specific characteristics of the instrument being analyzed.
Bollinger Bands are considered a reliable indicator, but like any technical analysis tool, they are not infallible. Traders should use Bollinger Bands in conjunction with other indicators and tools to confirm signals and avoid false alarms. It is also important to consider other factors, such as market trends and news events, when interpreting Bollinger Bands.

Understanding Knock-In Options on FX A knock-in option on the foreign exchange market (FX) is a type of derivative that only becomes active or …
Read Article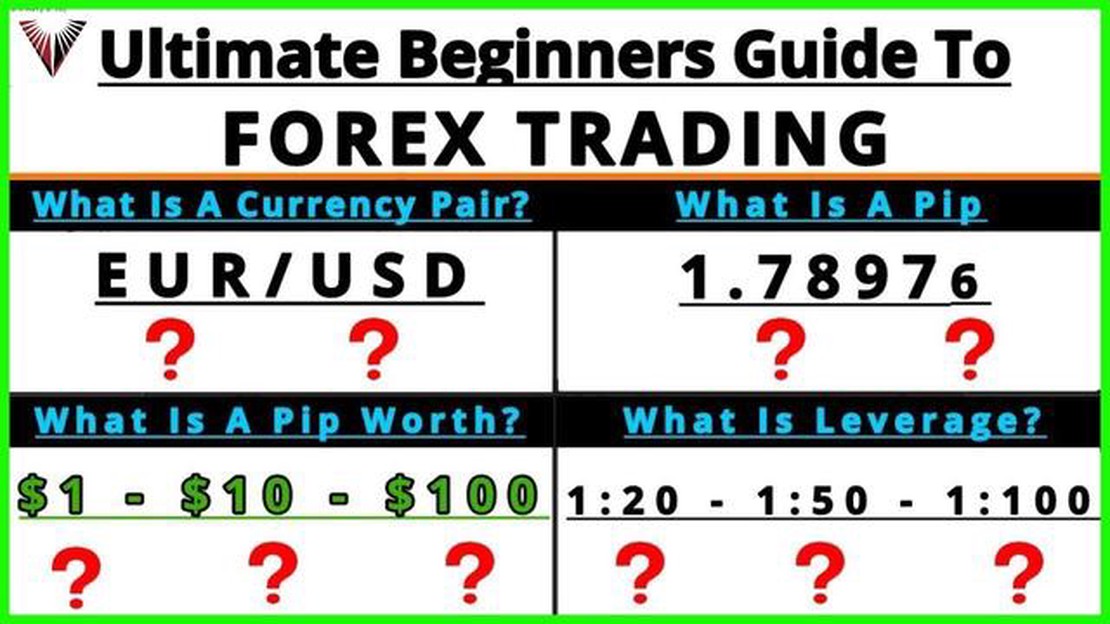
Beginner’s Guide: How to Start Learning Forex Trading Forex trading, also known as foreign exchange trading, is the buying and selling of currency …
Read Article
Can You Trade Forex After Hours? Trading forex can be an exciting and potentially lucrative venture, but many traders wonder if it’s possible to trade …
Read Article
Is joining IFA free? If you are considering joining the International Finance Association (IFA), you may be wondering whether there is a cost …
Read Article
Is there a screener for options? As a trader, having access to the right tools and resources can make all the difference in your success. When it …
Read Article
Euro Rate in Delhi: Exploring the Currency Exchange Options If you’re planning a trip to Delhi, India, it’s essential to stay updated on the current …
Read Article


