


What is the Opening Time for XAU Trading?
trading hours of XAU market If you are interested in trading gold, it is important to know the opening time for XAU trading. XAU is the symbol used to …
Read Article
When it comes to trading and analyzing financial markets, it is important to have access to various charts and indicators that can provide valuable insights. One such chart that is commonly used by traders is the M1 chart. The M1 chart, also known as the one-minute chart, is a type of candlestick chart that displays the price action of an asset over a one-minute period.
This chart is widely used by day traders and scalpers who prefer to make quick trading decisions based on short-term price movements. The M1 chart provides a detailed view of the market, allowing traders to identify trends and patterns that may not be visible on longer timeframes.
Traders often use the M1 chart in conjunction with other timeframes, such as the M5 (five-minute chart) or the H1 (one-hour chart), to gain a broader perspective of the market. By analyzing price movements across multiple timeframes, traders can make more informed trading decisions and improve their overall profitability.
It is important to note that the M1 chart can be highly volatile and sensitive to market noise. This means that prices can change rapidly within a one-minute period, making it crucial for traders to have a solid trading strategy and risk management plan in place.
In conclusion, the M1 chart is a valuable tool for traders who prefer to focus on short-term price movements. By analyzing price action on a one-minute timeframe, traders can gain valuable insights into market trends and make more informed trading decisions. However, it is important to exercise caution and use the M1 chart in conjunction with other timeframes to avoid falling victim to market noise.
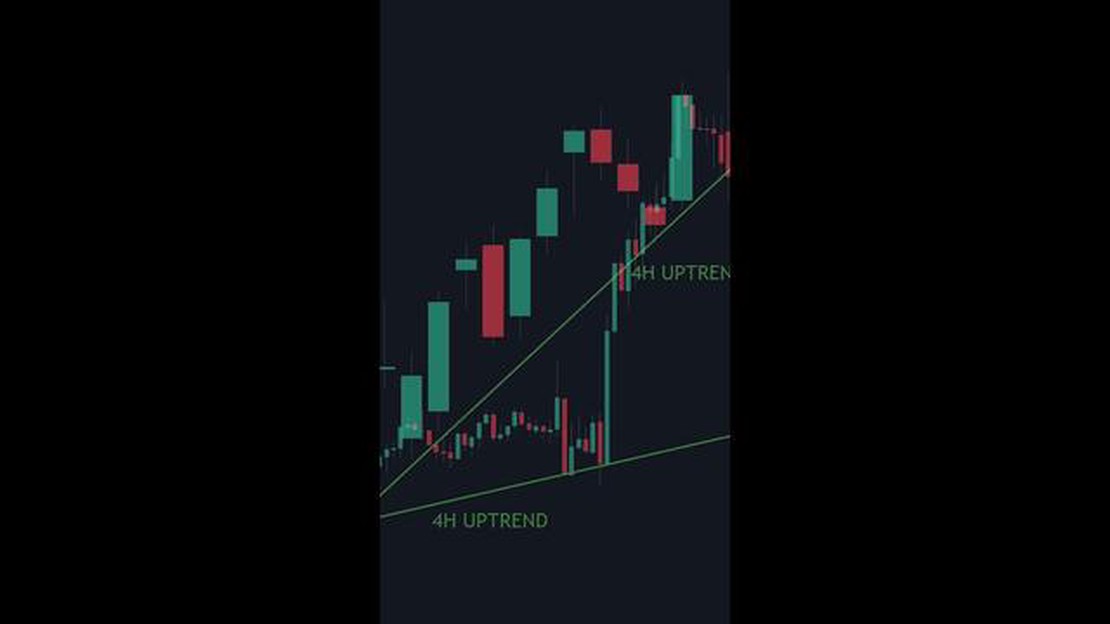
The M1 chart is a type of chart used in trading and technical analysis. It represents the price action of an asset over a one-minute time frame. Traders use the M1 chart to analyze short-term price movements and make decisions based on these patterns.

When looking at the M1 chart, each candlestick represents one minute of trading activity. The candlestick has several components, including the opening price, closing price, high price, and low price for that one-minute period. It also shows the direction of the price movement, with a green candlestick indicating an uptrend and a red candlestick indicating a downtrend.
The M1 chart is particularly useful for scalpers and day traders who aim to enter and exit positions quickly. It allows them to identify short-term trends, price reversals, and key support and resistance levels that may influence their trading decisions.
Traders often use technical indicators and tools in conjunction with the M1 chart to enhance their analysis and decision-making process. Some commonly used indicators include moving averages, stochastics, and MACD. These indicators can help traders spot potential entry and exit points, confirm trend reversals, and identify overbought or oversold conditions.
However, it’s important to note that the M1 chart can be quite volatile and subject to noise and false signals. Therefore, traders must apply proper risk management techniques and use additional time frames and charts to confirm their findings on the M1 chart.
In conclusion, the M1 chart provides valuable insights into short-term price movements and is used by traders to make quick trading decisions. By understanding the patterns and trends on the M1 chart, traders can increase their chances of success in the fast-paced world of trading.
Read Also: Understanding the Moving Minimum in Simulink and Its Applications
The M1 chart, or the one-minute chart, is an important tool in trading as it provides traders with valuable information about price action over short time intervals. This chart displays price movement during each one-minute period, allowing traders to quickly analyze market trends and make informed trading decisions.
Traders often use the M1 chart to identify short-term price patterns, such as reversals and breakouts, that can be indicative of potential trading opportunities. By closely monitoring the M1 chart, traders can spot key levels of support and resistance, as well as identify potential entry and exit points.
Read Also: Understanding the LSE Closing Auction: How It Works and Why It Matters
The M1 chart is especially useful for day traders and scalpers who focus on taking advantage of short-term price fluctuations. This chart provides them with a granular view of price movements, allowing for precise market analysis and quick execution of trades.
Furthermore, the M1 chart can also be used in conjunction with other time frames to confirm trading signals and enhance accuracy. Traders often compare the price action observed on the M1 chart with that of higher time frames, such as the M5 or M15 charts, to gain a more comprehensive understanding of market trends.
It is important for traders to note that while the M1 chart provides valuable insights into short-term price movements, it may also be susceptible to increased market noise and false signals. Therefore, it is crucial to use additional technical indicators, perform thorough analysis, and develop a solid trading strategy when utilizing the M1 chart.
In summary, the M1 chart is a powerful tool that offers traders a detailed view of short-term price movements. By analyzing this chart, traders can identify trading opportunities, determine entry and exit points, and enhance their overall trading strategy.
The M1 chart is a type of time frame used in trading that displays price data in one-minute intervals.

The M1 chart is important in trading because it provides traders with a detailed view of price movements within short time intervals, allowing for quick decision-making and analysis.
You can use the M1 chart in your trading strategy by identifying short-term trends, reversals, and patterns that occur within one-minute intervals. This can help you make quick trades and capitalize on short-term price movements.
No, the M1 chart is more suitable for short-term trading as it focuses on one-minute intervals. For long-term trading, longer time frames like daily or weekly charts are generally used.
Yes, there are limitations to using the M1 chart in trading. Due to its short time interval, the M1 chart can be more sensitive to noise and market volatility, making it important to consider other factors and indicators when making trading decisions.

trading hours of XAU market If you are interested in trading gold, it is important to know the opening time for XAU trading. XAU is the symbol used to …
Read Article
What is the new margin rule for options? The Securities and Exchange Commission (SEC) has recently implemented a new margin rule for options trading, …
Read Article
Understanding the Awesome Oscillator in Forex Trading Forex trading can be an exciting and lucrative venture, but it requires an in-depth …
Read Article
What is the name of ING Vysya bank? ING Vysya Bank was a banking institution that operated in India. The bank was a part of the larger ING Group, an …
Read Article
Understanding Growth Mutual Funds: Exploring Their Benefits and Risks Growth mutual funds are a type of investment fund that aims to generate capital …
Read Article
Understanding Interest Rate Differential in Forex Trading The foreign exchange market, often referred to as forex, is the largest and most liquid …
Read Article


