
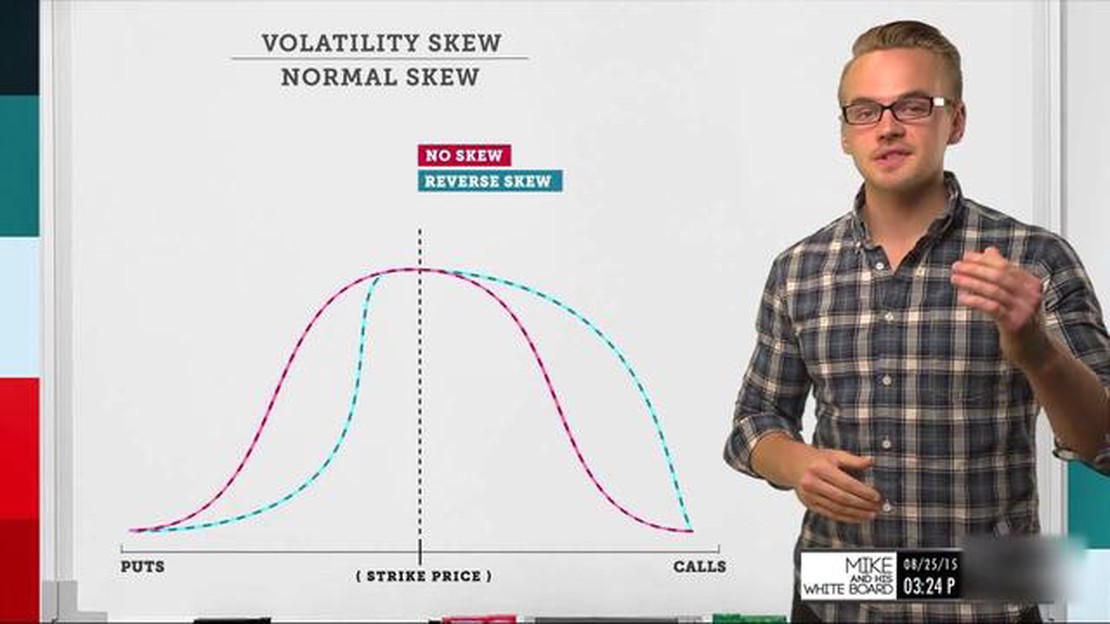

Understanding the Skew in Options Pricing: An In-Depth Analysis
What is the skew of options pricing? Options trading is a complex financial instrument that involves buying and selling contracts based on the future …
Read Article

Forex trading can be an exciting and lucrative venture, but it requires an in-depth understanding of various technical indicators to make informed trading decisions. One such indicator that has gained popularity among traders is the Awesome Oscillator. The Awesome Oscillator is a versatile and powerful tool that helps traders identify market trends, measure market momentum, and predict potential price reversals.
The Awesome Oscillator, developed by Bill Williams, is a histogram-based indicator that measures the difference between a 34-period and a 5-period simple moving average. It reflects the momentum of the market by comparing the current price with the high and low of the previous bars. The resulting histogram helps traders visualize the strength and weakness of the market, providing valuable insights into potential trading opportunities.
The Awesome Oscillator is composed of two components - the histogram and the zero line. The histogram represents the difference between the two moving averages, with positive values indicating bullish momentum and negative values indicating bearish momentum. The zero line is a critical level that separates bullish and bearish territory. When the histogram crosses above the zero line, it indicates a bullish signal, while a cross below the zero line indicates a bearish signal.
Using the Awesome Oscillator in your forex trading strategy can provide valuable insights into market trends and potential reversals. By understanding the signals generated by this indicator, traders can make more informed trading decisions and increase their chances of success in the forex market.
The Awesome Oscillator is a technical indicator that is used in forex trading to help traders identify potential trend reversals and the strength of a trend. It was developed by Bill Williams, a renowned trader and author of several books on trading psychology.
The Awesome Oscillator is displayed as a histogram that oscillates above and below a zero line. The histogram consists of red and green bars, with red bars indicating a bearish trend and green bars indicating a bullish trend.
The calculation of the Awesome Oscillator involves subtracting a 34-period simple moving average (SMA) from a 5-period SMA. The resulting value is then plotted on the chart as a histogram.
Traders use the Awesome Oscillator to determine the momentum of a trend. When the histogram is above the zero line and green, it suggests that the bullish momentum is increasing. Conversely, when the histogram is below the zero line and red, it indicates that the bearish momentum is gaining strength.
In addition to identifying trend strength, the Awesome Oscillator can also help traders spot potential trend reversals. When the histogram crosses above the zero line from negative to positive, it suggests a bullish trend reversal. Conversely, when the histogram crosses below the zero line from positive to negative, it indicates a bearish trend reversal.
It is important to note that the Awesome Oscillator is most effective when used in conjunction with other technical indicators and analysis tools. Traders often combine it with other indicators such as moving averages, trendlines, and support and resistance levels to confirm trading signals.
Overall, the Awesome Oscillator is a useful tool for forex traders to gauge trend strength and potential reversals. By understanding how to interpret the histogram and its relationship to the zero line, traders can make more informed trading decisions and increase their chances of success in the forex market.
The Awesome Oscillator is a popular technical analysis tool used in forex trading. It is designed to help traders identify the momentum behind price movements and determine potential entry and exit points.

The Awesome Oscillator consists of two moving averages, referred to as the fast and slow lines. The fast line is calculated by subtracting the 34-period simple moving average (SMA) from the 5-period SMA, while the slow line is calculated by subtracting the 5-period SMA from the 34-period SMA.
Read Also: Exploring the Size of the Options Market in Comparison to the Stock Market
When the fast line crosses above the slow line, it indicates that bullish momentum is increasing. Conversely, when the fast line crosses below the slow line, it indicates that bearish momentum is increasing. Traders can use these crossovers to enter or exit trades.
In addition to crossovers, the Awesome Oscillator also provides signals based on the distance between the two lines. A larger distance between the lines suggests stronger momentum, while a smaller distance suggests weaker momentum. Traders can use this information to gauge the strength of a trend and adjust their trading strategies accordingly.
Furthermore, the Awesome Oscillator uses a zero line to distinguish between bullish and bearish momentum. When the oscillator is above the zero line, it indicates bullish momentum, and when it is below the zero line, it indicates bearish momentum.
It’s important to note that the Awesome Oscillator should not be used as a standalone tool for making trading decisions. It should be used in conjunction with other technical analysis tools and indicators to confirm signals and improve accuracy.
Overall, the Awesome Oscillator is a versatile tool that can help traders identify and capitalize on trends in the forex market. By understanding how it works and incorporating it into their trading strategies, traders can potentially improve their trading outcomes.
The Awesome Oscillator (AO) is a popular technical indicator used in forex trading to identify potential trends and reversal points. It is based on the difference between a 34-period and a 5-period simple moving average (SMA) on the price chart.
To calculate the Awesome Oscillator, first, we need to calculate the values of the two SMAs. The 34-period SMA is the average of the closing prices of the last 34 candles, while the 5-period SMA is the average of the closing prices of the last 5 candles.
Next, we subtract the value of the 5-period SMA from the value of the 34-period SMA. The resulting difference is plotted on the price chart as the Awesome Oscillator histogram. The histogram can take positive or negative values, depending on whether the 5-period SMA is higher or lower than the 34-period SMA.
Read Also: Can you use Swish for Forex transactions?
The Awesome Oscillator can help traders identify two types of signals. The first signal is a bullish signal, which occurs when the histogram bars change from red to green and become larger in size. This suggests that the momentum is shifting from sellers to buyers and that a potential upward trend may emerge.

The second signal is a bearish signal, which occurs when the histogram bars change from green to red and become larger in size. This suggests that the momentum is shifting from buyers to sellers and that a potential downward trend may emerge.
It’s important to note that the Awesome Oscillator is a lagging indicator, meaning that it may not provide timely signals for entering or exiting trades. Traders often use it in conjunction with other technical analysis tools to confirm its signals and make more informed trading decisions.
In conclusion, the Awesome Oscillator is a calculation based on the difference between a 34-period and a 5-period SMA. It helps traders identify potential trends and reversal points in the forex market. However, it’s important to use it in conjunction with other tools for more accurate and timely decision making.
The Awesome Oscillator is a technical indicator used in forex trading to measure the market momentum of a currency pair.
The Awesome Oscillator calculates the difference between the 34-period and 5-period simple moving averages on the price chart. It then displays this difference as a histogram, with positive values indicating bullish momentum and negative values indicating bearish momentum.
The Awesome Oscillator helps traders identify changes in market momentum, which can be used as a signal for potential trading opportunities. It can also help confirm trends and provide insight into the strength of market movements.
Traders can use the Awesome Oscillator in various ways. Some common strategies include looking for divergence between the oscillator and price movement, using it as a confirmation tool for trend reversals, or using it to identify overbought or oversold conditions.
Like any technical indicator, the Awesome Oscillator has its limitations. It may not be suitable for all market conditions or trading styles and should be used in conjunction with other analysis tools. Additionally, it may generate false signals in choppy or sideways markets.
The Awesome Oscillator is a technical indicator used in Forex trading to measure market momentum. It is based on the difference between a 34-period and a 5-period Simple Moving Average (SMA) of the price’s midpoint. It helps traders to identify the strength and weakness of the market trend.
The Awesome Oscillator is not typically used as a standalone indicator but is often used in conjunction with other technical indicators. It is mainly used to confirm trade signals generated by other indicators or to identify potential reversals in the market trend.

What is the skew of options pricing? Options trading is a complex financial instrument that involves buying and selling contracts based on the future …
Read Article
Upgrading Your Options Level on Questrade If you’re an active investor or trader, you may be interested in exploring options trading. Options can …
Read Article
Is Forex trading fraud? Forex trading is a popular form of investment that has gained significant attention in recent years. However, with the rise in …
Read Article
How much is an NQ contract? Are you interested in investing in NQ contracts? Do you want to know how much they cost? Look no further! In this article, …
Read Article
What is 162 m compensation? 162m compensation refers to compensation packages or payouts that are valued at 162 million dollars or more. These …
Read Article
What is the Fair Market Value of a stock exercise? Investing in stocks often involves making decisions based on the fair market value (FMV) of a …
Read Article


