


Top Banks That Trade Forex: A Comprehensive Guide
Top Banks Trading Forex Forex trading, also known as foreign exchange trading, is the global market for buying and selling different currencies. It is …
Read Article
The Exponential Moving Average (EMA) formula is a popular mathematical tool used in technical analysis to analyze and predict trends in financial data. It is a type of moving average that places more weight on recent data points, making it more responsive to recent price changes compared to other types of moving averages.
The EMA formula calculates the average price of a security over a specific period, giving more weight to the most recent prices. This is done by applying a multiplier to each price data point, which decreases exponentially as you move further back in time. The multiplier is determined by the length of the period used in the calculation, and it can be adjusted to fit the specific time frame and sensitivity desired by the analyst.
The EMA formula is often used in conjunction with other technical analysis tools, such as support and resistance levels, to identify trend reversals and generate buy or sell signals. Traders and investors use EMA crossovers, where the shorter-term EMA crosses above or below the longer-term EMA, as an indication of potential trend changes or momentum shifts.
For example, a bullish signal is generated when the shorter-term EMA crosses above the longer-term EMA, suggesting that the price may continue to rise. Conversely, a bearish signal is generated when the shorter-term EMA crosses below the longer-term EMA, suggesting that the price may decline.
The EMA formula is flexible and can be adjusted to fit different time frames and trading strategies. It is widely used in technical analysis and is favored by many traders and analysts for its ability to quickly respond to price changes and capture short-term trends.
The Exponential Moving Average (EMA) is a popular technical indicator used in financial analysis to smooth out price data and identify trends. The EMA places more weight on recent data points, making it more responsive to price changes compared to other moving averages.
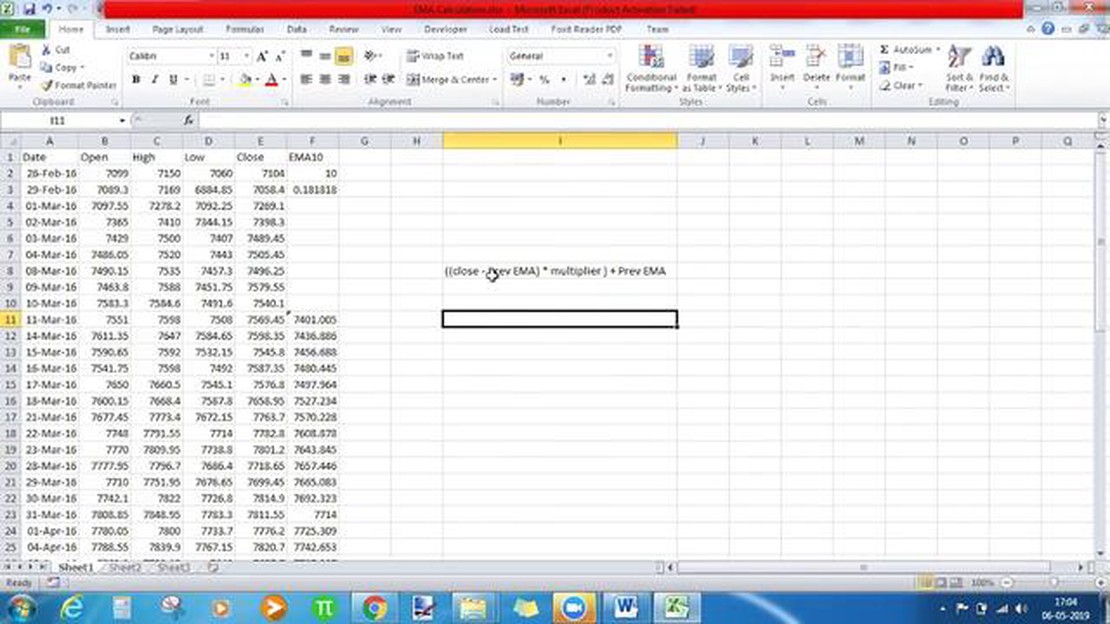
The formula for calculating the EMA involves a recursive calculation, where each subsequent EMA value depends on the previous EMA value and the current period’s closing price. The formula is as follows:
EMA = (Close - EMAprev) * (2 / (n + 1)) + EMAprev
Where:

Close represents the closing price of the current periodEMAprev represents the previous EMA valuen represents the number of periods used in the EMA calculationTo calculate the initial EMA value, a simple moving average (SMA) is typically used as the starting point. The SMA is calculated by summing up the closing prices over a specified number of periods and dividing the sum by the number of periods. The SMA is then used as the starting value for the EMA calculation.
The choice of the period for the EMA calculation depends on the trader’s preference and the time frame being analyzed. Shorter periods, such as 10 or 20, are often used for intraday trading, while longer periods, such as 50 or 200, are commonly used for longer-term analysis.
The EMA formula allows traders to identify trends and potential buy or sell signals. When the current price is above the EMA, it suggests a bullish trend, and when the current price is below the EMA, it suggests a bearish trend. Traders often use the crossing of the price and EMA lines as a signal to enter or exit trades.
In summary, the EMA formula is a powerful tool for smoothing price data and identifying trends in financial markets. By placing more weight on recent data points, the EMA provides a more responsive indicator compared to other moving averages. Traders can use the EMA formula to generate trading signals and make informed decisions based on market trends.
Read Also: Discover the highest grossing trading card game on the market
The Exponential Moving Average (EMA) is a popular technical analysis indicator that is used to track the trend of a financial asset’s price over a specific time period. It is similar to a simple moving average (SMA), but the EMA places more weight on recent prices.
The EMA is calculated using a formula that gives more importance to recent data points while still taking into account older data. This makes it useful for traders and investors who want to focus on the most recent price movements.
Read Also: Understanding the Forex Master Pattern and How It Can Boost Your Trading Strategy
Unlike the SMA, which gives equal weight to all data points, the EMA assigns exponentially decreasing weights to each data point. The formula for calculating the EMA is as follows:
EMA = (Close - EMAprevious) * (2 / (time period + 1)) + EMAprevious
Where:
As the formula suggests, the EMA is calculated recursively, starting with the initial EMA value for the chosen time period. Each subsequent EMA is calculated using the previous EMA value and the most recent closing price.

The EMA is often displayed as a line on a price chart and is used by traders to identify potential buy or sell signals. When the price crosses above the EMA, it is considered a bullish signal, indicating that the trend may be turning upwards. Conversely, when the price crosses below the EMA, it is considered a bearish signal, indicating that the trend may be turning downwards.
Overall, the EMA is a widely used technical indicator that helps traders and investors analyze price trends and make informed trading decisions. It is especially useful for those who want to place greater emphasis on recent price movements.
The Exponential Moving Average (EMA) formula is used to calculate the average of a set of data points over a specified period of time. It gives more weight to recent data points, making it more responsive to changes in price or other variables. The formula is: EMA = (Close - Previous EMA) * (2 / (n + 1)) + Previous EMA, where Close is the current closing price, n is the period of time, and Previous EMA is the previous EMA value.
The EMA formula differs from the Simple Moving Average (SMA) formula in that it gives more weight to recent data points. While the SMA calculates the average of a set of data points over a specified period of time, giving equal weight to each data point, the EMA places more importance on recent data points, making it more responsive to changes in price or other variables.
The constant “2 / (n + 1)” in the EMA formula determines the weight given to each data point. The larger the value of n, the smaller the weight given to each data point. This constant ensures that the sum of the weights for all data points is equal to 1. It is derived from the exponential smoothing technique, which is used to assign weights to data points based on the desired level of responsiveness to changes.
The EMA for the first data point is typically calculated using the Simple Moving Average (SMA) formula. This is because there is no previous EMA value to use in the calculation. Once the first EMA is calculated, it can be used as the Previous EMA value for the calculation of subsequent EMAs.
The EMA formula is commonly used in trading and investing as a technical indicator. It is used to identify trends, generate buy or sell signals, and set stop-loss or take-profit levels. As the EMA places more weight on recent data points, it is believed to provide more timely signals compared to other moving averages. Traders and investors use different time periods for the EMA to suit their trading or investing strategies.

Top Banks Trading Forex Forex trading, also known as foreign exchange trading, is the global market for buying and selling different currencies. It is …
Read Article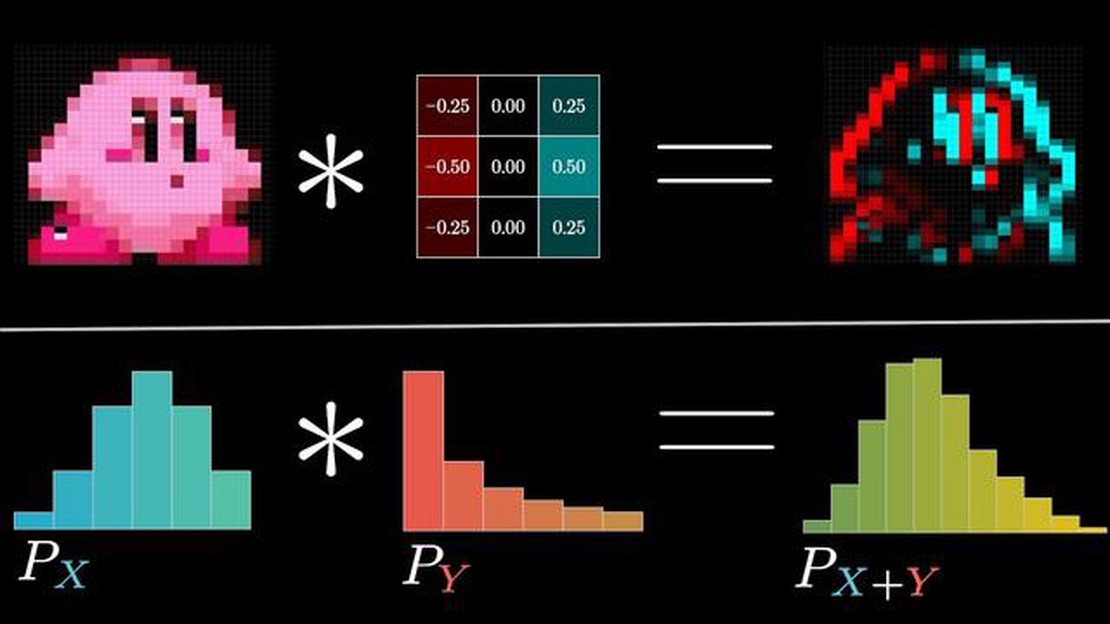
Is a moving average a convolution? A moving average and a convolution are two common techniques used in signal processing and time series analysis. …
Read Article
Current Silver Prices: High or Low? Investing in silver can be a profitable venture, but knowing when to buy or sell can be challenging. As with any …
Read Article
How to Add 200 DMA in TradingView If you’re a trader looking to analyze and make informed decisions in the financial markets, you may have heard of …
Read Article
Can I start trading with R100? Have you ever wondered if it’s possible to start trading with just R100? If you’ve been interested in the world of …
Read Article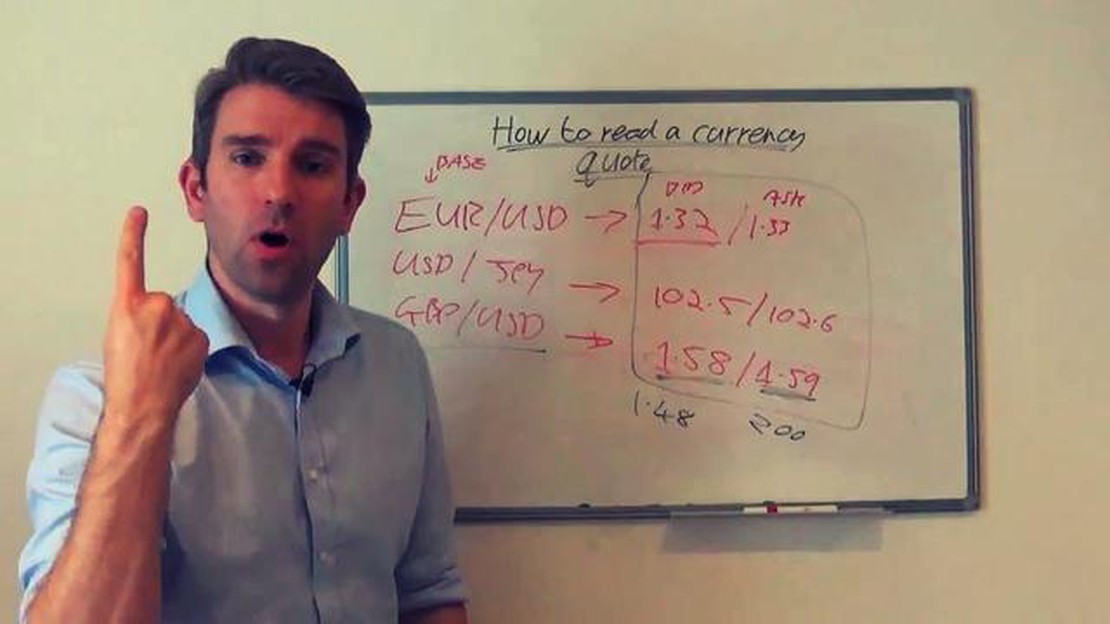
Understanding the Process of Quoting FX Rates Currency exchange rates play a crucial role in the global economy, affecting international trade, …
Read Article


