Understanding the Exponential Moving Average Crossover Screener
The Exponential Moving Average (EMA) Crossover Screener is a technical analysis tool used by traders and investors to identify potential trading opportunities. It is based on the concept of two EMAs crossing over each other, indicating a change in the trend of a security or an asset.
EMAs are calculated using a weighted average of the past prices, giving more weight to recent data points. This makes EMAs more responsive to recent price changes compared to simple moving averages.
Table Of Contents
The EMA Crossover Screener works by plotting two EMAs on a price chart and monitoring their crossovers. When the shorter-term EMA crosses above the longer-term EMA, it generates a bullish signal, suggesting that the price may continue to rise. Conversely, when the shorter-term EMA crosses below the longer-term EMA, it generates a bearish signal, suggesting that the price may continue to decline.
Traders and investors use the EMA Crossover Screener to identify potential entry and exit points in the market. For example, a trader may use a bullish EMA crossover as a signal to buy a stock or a bearish EMA crossover as a signal to sell a stock. The EMA Crossover Screener can be used with different timeframes and can be applied to various financial instruments, such as stocks, commodities, and forex.
Overall, the Exponential Moving Average Crossover Screener is a powerful tool that helps traders and investors to identify potential trading opportunities based on the crossover of two EMAs. It provides a simple yet effective way to analyze the market trend and make informed trading decisions.
Understanding Exponential Moving Averages (EMA)
An Exponential Moving Average (EMA) is a type of moving average that gives more weight to recent data points, making it more responsive to recent price changes compared to a Simple Moving Average (SMA). It is a commonly used technical indicator in financial analysis and charting.
The calculation of an EMA involves giving a exponentially decreasing weightage to each data point, with more weight given to recent data points. The formula for calculating an EMA is as follows:
EMA = (Current Data Point * Smoothing Factor) + (Previous EMA * (1 - Smoothing Factor))
The smoothing factor is a constant value that determines the rate at which the weightage of each data point decreases as you move further back in time. The most commonly used smoothing factor is 2 / (n + 1), where n is the number of time periods you are considering for the moving average. For example, if you are using a 10-day EMA, the smoothing factor would be 2 / (10 + 1) = 0.1818.
The EMA is a popular indicator among traders and investors because it is believed to provide more timely signals compared to other moving averages. Since it gives more weight to recent data, it is able to react faster to changes in market trends or price movements. This can help traders identify potential entry or exit points in the market.
EMA crossovers are a common trading strategy where traders look for the EMA line to cross above or below another EMA line to generate buy or sell signals. For example, if the shorter-term EMA (e.g., 10-day EMA) crosses above the longer-term EMA (e.g., 50-day EMA), it may signal a bullish trend and a potential buy signal. Conversely, if the shorter-term EMA crosses below the longer-term EMA, it may signal a bearish trend and a potential sell signal.
In conclusion, the Exponential Moving Average (EMA) is a popular technical indicator that gives more weight to recent data points, making it more responsive to recent price changes compared to the Simple Moving Average (SMA). It is used by traders and investors to identify potential entry or exit points in the market and can be used in conjunction with other technical indicators to make informed trading decisions.
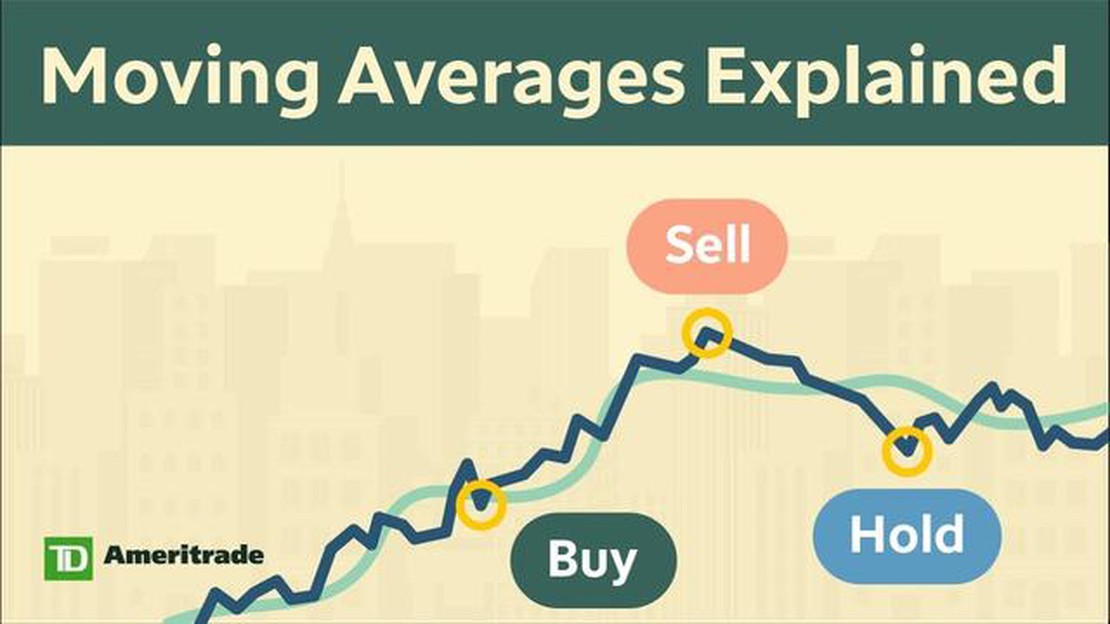
What is a Moving Average Crossover?
A moving average crossover is a popular technical analysis tool that helps traders identify potential changes in market trends and generate trading signals. It involves plotting two or more moving averages of different time periods on a price chart and observing when the shorter-term moving average crosses above or below the longer-term moving average.
The moving average crossover is based on the premise that shorter-term moving averages tend to react more quickly to price changes, while longer-term moving averages provide a smoother representation of the overall trend. When the shorter-term moving average crosses above the longer-term moving average, it is seen as a bullish signal, indicating an uptrend may be developing. Conversely, when the shorter-term moving average crosses below the longer-term moving average, it is considered a bearish signal and may suggest a potential downtrend.
An important aspect of using moving average crossovers is selecting the appropriate time periods for the moving averages. Traders typically use popular combinations such as the 10-day and 50-day moving averages or the 50-day and 200-day moving averages. However, the choice of time periods may vary depending on the trader’s preferred trading style and the specific market being analyzed.
Moving average crossovers can be used as standalone signals or in combination with other technical indicators to validate trading decisions. Traders may also apply different strategies, such as waiting for confirmation or using multiple crossover signals, to improve their accuracy.
Overall, moving average crossovers can provide traders with valuable insights into potential trend reversals and entry/exit points in financial markets. However, it is important to remember that no indicator is foolproof, and traders should always consider other factors such as market conditions, fundamental analysis, and risk management when making trading decisions.
Why Use the Exponential Moving Average Crossover Screener?
The Exponential Moving Average (EMA) Crossover Screener is a powerful tool for technical analysis that can help traders identify potential buying and selling opportunities in the stock market. Here are a few reasons why traders use the EMA Crossover Screener:
1. Trend identification: The EMA Crossover Screener helps traders identify trends in stock prices by analyzing the crossing points of two or more moving averages. By comparing short-term and long-term moving averages, traders can determine if a stock is in an uptrend or downtrend.
2. Entry and exit signals: The EMA Crossover Screener generates entry and exit signals based on the crossing of moving averages. When the short-term moving average crosses above the long-term moving average, it generates a buy signal, indicating a potential entry point. Conversely, when the short-term moving average crosses below the long-term moving average, it generates a sell signal, indicating a potential exit point.
3. Confirmation of trends: The EMA Crossover Screener can be used to confirm trends identified through other technical analysis tools. By using the EMA Crossover Screener in conjunction with other indicators, traders can increase their confidence in their trading decisions.
4. Flexibility: The EMA Crossover Screener allows traders to customize the parameters of the moving averages based on their trading strategies. Traders can choose different time periods for the short-term and long-term moving averages, depending on their preferred trading horizon.
In conclusion, the Exponential Moving Average Crossover Screener is a valuable tool for traders as it helps identify trends, generate entry and exit signals, confirm trends, and offers flexibility in trading strategies. By incorporating this screener into their trading toolkit, traders can make more informed and profitable trading decisions.
FAQ:
What is the Exponential Moving Average Crossover Screener?
The Exponential Moving Average Crossover Screener is a tool used in technical analysis to identify potential trading opportunities based on the crossing over of two exponential moving averages. It helps traders identify when a short-term moving average crosses above or below a long-term moving average, which can indicate a change in market momentum.
How does the Exponential Moving Average Crossover Screener work?
The Exponential Moving Average Crossover Screener works by plotting two exponential moving averages (EMA) on a chart. When the short-term EMA crosses above the long-term EMA, it generates a bullish signal, indicating that the market trend may be changing to an upward direction. Conversely, when the short-term EMA crosses below the long-term EMA, it generates a bearish signal, indicating a potential downward trend.
What are exponential moving averages?
Exponential moving averages (EMA) are a type of moving average that places more weight on recent price data. This means that the EMA reacts more quickly to recent price changes compared to other moving averages, such as the simple moving average (SMA). EMAs are commonly used by traders to identify trends and potential entry and exit points in the market.
Can the Exponential Moving Average Crossover Screener be used for any financial instrument?
Yes, the Exponential Moving Average Crossover Screener can be used to analyze any financial instrument that has historical price data available. It is commonly used for stocks, commodities, forex pairs, and other trading instruments. Traders can adjust the timeframe and parameters of the moving averages based on the specific instrument and trading strategy.
Are there any drawbacks or limitations to using the Exponential Moving Average Crossover Screener?
While the Exponential Moving Average Crossover Screener can be a useful tool, it is important to note that it is based on historical price data and does not guarantee future market movements. False signals can occur during choppy or sideways markets, resulting in potential false trading opportunities. Additionally, the screener should be used in conjunction with other technical analysis tools and risk management strategies to make informed trading decisions.
What is the Exponential Moving Average Crossover Screener?
The Exponential Moving Average Crossover Screener is a tool used by traders to identify potential buy or sell signals in the stock market. It involves comparing two different exponential moving averages of a stock’s price and looking for crossovers, where the shorter-term moving average crosses above or below the longer-term moving average.
Step-by-Step Guide to Opening a Forex Trading Account Forex trading is a popular investment option that allows individuals to trade currencies in the …
What is the Dollar Index Symbol in Forex? Forex trading involves the buying and selling of currencies, and one of the most commonly traded currencies …