


Understanding the Inner Workings of Automatic Manual Transmission (AMT) Systems
Understanding the Functionality of the AMT System In today’s world of advanced automotive technology, the automatic manual transmission (AMT) system …
Read Article
When it comes to analyzing stock market trends and making informed investment decisions, understanding key technical indicators is essential. One such indicator is the 5-day moving average, which plays a significant role in predicting short-term market movements. This article will delve into the concept of the 5-day moving average, how it works, and why it matters for traders and investors.
The 5-day moving average is a widely used technical indicator that smooths out short-term fluctuations in stock prices and helps traders identify trends. It calculates the average price of a security over a specified period, typically five trading days, by summing up the closing prices and dividing the total by the number of periods. This moving average is updated on a daily basis to provide a snapshot of recent price action.
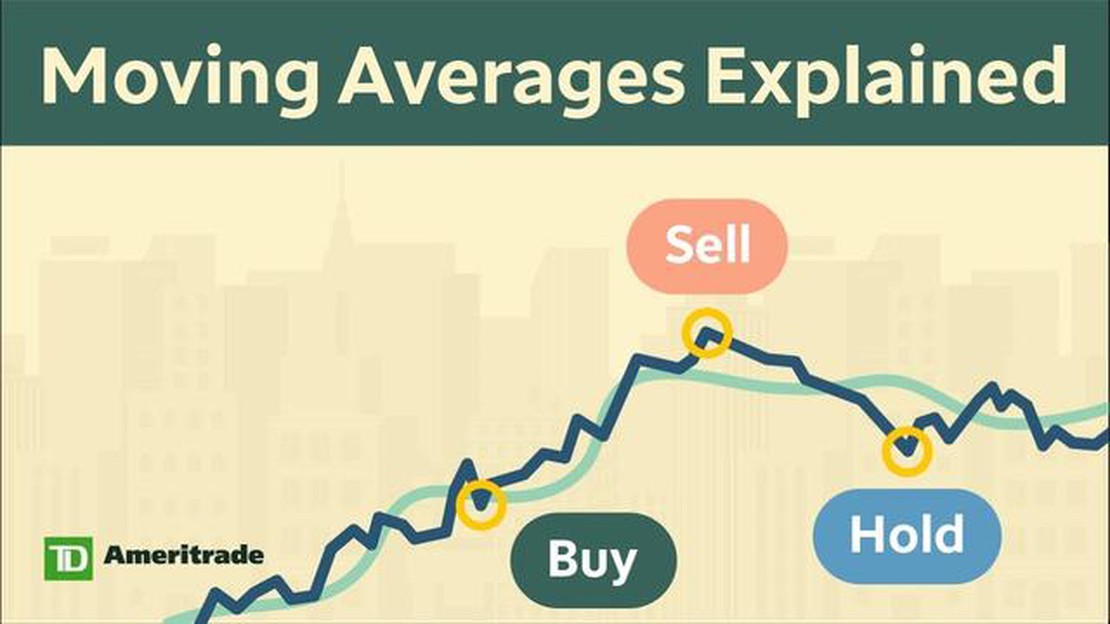
Why is the 5-day moving average important? First and foremost, it helps traders filter out noise and distinguish between random price movements and meaningful trends. By smoothing out short-term volatility, it makes it easier to identify the direction of the market and spot potential buying or selling opportunities. Additionally, the 5-day moving average can serve as dynamic support or resistance levels, signaling when a stock is likely to reverse its direction.
Moreover, the 5-day moving average can be combined with other technical indicators to generate trading signals. For example, a bullish crossover occurs when the price of a stock rises above its 5-day moving average, indicating a potential uptrend. Conversely, a bearish crossover happens when the price falls below the moving average, suggesting a possible downtrend. By paying attention to these crossovers, traders can make more informed decisions and improve their overall trading performance.
In conclusion, understanding the 5-day moving average is crucial for traders and investors looking to navigate the stock market successfully. It helps identify trends, filter out noise, and generate trading signals. By incorporating this technical indicator into their analysis, individuals can enhance their decision-making process and increase their chances of making profitable trades.

The 5 Day Moving Average, also known as the 5-day MA, is a popular technical indicator used in financial markets to analyze price trends over a short period of time. It is calculated by taking the average of the closing prices of an asset over the past five trading days.
The 5-day MA is considered a short-term moving average and is often used in conjunction with other moving averages to get a more comprehensive picture of an asset’s price movement. It is particularly useful for short-term traders who want to identify shorter-term trends and make more timely trading decisions.
By smoothing out the day-to-day price fluctuations, the 5-day MA helps to filter out some of the noise in the market, making it easier to identify the overall direction of the price. It provides a simple yet effective way to determine whether an asset’s price is trending up or down over a short period of time.
Traders commonly use the 5-day MA as a reference point for determining support and resistance levels. When the price is above the 5-day MA, it is often seen as a bullish signal, indicating that the trend is up and the asset may continue to rise in price. Conversely, when the price is below the 5-day MA, it is seen as a bearish signal, suggesting that the trend is down and the asset may continue to decline in price.
Overall, the 5 Day Moving Average is a simple yet powerful tool that can provide valuable insights into an asset’s short-term price movement. Whether you’re a short-term trader looking for trading opportunities or a long-term investor wanting to gauge the overall trend, the 5-day MA can be a helpful tool in your analysis toolbox.
Read Also: Understanding Warrants: Are They Considered Equity or Liability?
The 5 Day Moving Average is a technical analysis tool used by traders and investors to track the average price of an asset over a specific time period. It is calculated by taking the sum of the closing prices of the asset over the past five trading days and dividing it by five. The resulting number represents the average price of the asset over the five-day period.
The 5 Day Moving Average is often used to identify trends and support or resistance levels in the market. Traders use it to smooth out short-term price fluctuations and gain a clearer understanding of the overall direction of the asset’s price movement.
Read Also: Choosing the Best Indicator for 1-Hour Charts: Expert Advice
By analyzing the 5 Day Moving Average, traders can determine whether the price of an asset is trending upwards, downwards, or moving sideways. If the 5 Day Moving Average is sloping upwards, it indicates that the asset’s price is generally increasing over time. Conversely, if the 5 Day Moving Average is sloping downwards, it suggests that the asset’s price is decreasing. A flat or horizontal 5 Day Moving Average signals that the asset’s price is relatively stable and not experiencing significant changes.
In addition to determining the direction of the price trend, the 5 Day Moving Average can also act as a support or resistance level. If the asset’s price is trading above the 5 Day Moving Average, it can be considered a support level, as the average price is providing a floor for the asset’s price and preventing it from dropping further. On the other hand, if the asset’s price is trading below the 5 Day Moving Average, it can be seen as a resistance level, as the average price is acting as a ceiling and preventing the asset’s price from rising.
Traders often use the 5 Day Moving Average in conjunction with other technical indicators and chart patterns to make more informed trading decisions. It is important to note that the 5 Day Moving Average is just one tool among many and should not be relied upon solely for trading decisions. However, when used in combination with other indicators, it can provide valuable insights into an asset’s price movements and help traders identify potential buying or selling opportunities.
A moving average is a statistical calculation used to analyze data over a certain period of time. It is commonly used in finance and other fields to smooth out fluctuations and identify trends.
A 5 day moving average calculates the average value over the past 5 days. It is updated each day by dropping the oldest value and adding the newest value. This helps to identify short-term trends and mitigate the impact of outliers.

Understanding the 5 day moving average can provide valuable insights into short-term trends and the overall direction of a dataset. It can help investors and analysts make informed decisions and identify potential entry or exit points.
While the 5 day moving average can be useful for short-term analysis, it may not capture longer-term trends or provide a complete picture of the data. It is important to use it in conjunction with other tools and indicators for a more comprehensive analysis.
Absolutely! The 5 day moving average can be applied to any dataset that exhibits trends or fluctuations over time. It is widely used in fields such as economics, marketing, and weather forecasting to analyze and predict patterns.
A moving average is a calculation used to analyze data points by creating a series of averages over a certain period of time. It works by taking the average of a set of data points and then continuously updating the average as new data points are added and older data points are dropped.

Understanding the Functionality of the AMT System In today’s world of advanced automotive technology, the automatic manual transmission (AMT) system …
Read Article
What is the forecast for 3D Systems? 3D Systems is a leading company in the field of 3D printing technology. With its innovative products and …
Read Article
What is the Exponentially Weighted Moving Average of the Time Series? Time series analysis is a powerful tool in data analysis that helps uncover …
Read Article
Regulation of Forward Contracts in India Forward contracts are an essential tool in the financial market that allow parties to secure the future …
Read Article
Understanding the Profit Sharing Program in Brazil: Benefits and Regulations Profit sharing programs are becoming increasingly popular in Brazil as a …
Read Article
What is the difference between a call and put FX option? Foreign exchange (FX) options are a popular financial instrument used by traders and …
Read Article


