


Benefits of Offering Stock Options: Why Do Companies Grant Stock Options?
Reasons Companies Grant Stock Options Stock options are a form of compensation that many companies offer to their employees. It is a popular incentive …
Read Article
In the world of trading, identifying overbought and oversold conditions is essential for making informed investment decisions. Overbought and oversold conditions occur when the price of an asset has moved too far in one direction and is likely to reverse.
There are many indicators that can be used to identify overbought and oversold conditions, but one of the most popular and widely used is the Relative Strength Index (RSI). The RSI is a momentum oscillator that measures the speed and change of price movements. It ranges from 0 to 100 and is typically plotted on a chart alongside the price.
When the RSI is above 70, it is considered overbought, indicating that the asset may be due for a price correction or reversal. Conversely, when the RSI is below 30, it is considered oversold, suggesting that the asset may be undervalued and due for a price increase. Traders often use these levels as a signal to enter or exit a trade.
While the RSI is a popular indicator, it is important to note that no single indicator is foolproof. Traders often use a combination of indicators and other technical analysis tools to confirm signals and make more accurate predictions. Additionally, it is important to consider other factors such as market trends, news events, and fundamental analysis when identifying overbought and oversold conditions.
In conclusion, the best indicator to identify overbought and oversold conditions is subjective and may vary depending on individual trading strategies and preferences. However, the RSI is widely used and considered a reliable tool for identifying these conditions. Traders should use the RSI in conjunction with other indicators and analysis techniques to make well-informed trading decisions.
Overbought and oversold conditions are key concepts in technical analysis that help traders identify potential trend reversals or corrective moves in financial markets. These conditions occur when an asset’s price has reached extreme levels and is ripe for a reversal or retracement.
In simple terms, overbought conditions occur when the price of an asset has increased significantly over a short period, indicating that buyers may have pushed the price too high and that a correction may be imminent. On the other hand, oversold conditions occur when the price of an asset has decreased significantly over a short period, indicating that sellers may have pushed the price too low and that a rebound may occur.

Traders use various technical indicators to identify overbought and oversold conditions. One popular indicator is the Relative Strength Index (RSI), which measures the speed and change of price movements. The RSI ranges from 0 to 100, with readings above 70 suggesting an overbought condition and readings below 30 suggesting an oversold condition. Traders can look for divergences or overreactions in the RSI to confirm these conditions.
Another commonly used indicator is the Stochastic Oscillator, which compares an asset’s closing price to its price range over a given period. Like the RSI, the Stochastic Oscillator ranges from 0 to 100, with readings above 80 indicating an overbought condition and readings below 20 indicating an oversold condition. Traders can also monitor the %K and %D lines of the Stochastic Oscillator for potential crossovers or divergences.
It is important to note that while these indicators are useful for identifying overbought and oversold conditions, traders should not solely rely on them for making trading decisions. Other factors, such as market trends, support and resistance levels, and overall market sentiment, should also be taken into consideration.
| Indicator | Overbought Condition | Oversold Condition |
|---|---|---|
| Relative Strength Index (RSI) | Readings above 70 | Readings below 30 |
| Stochastic Oscillator | Readings above 80 | Readings below 20 |
Read Also: How to Draw Supply and Demand Zones: The Ultimate Guide
In conclusion, overbought and oversold conditions are important concepts for traders to understand when analyzing financial markets. By using technical indicators such as the RSI and Stochastic Oscillator, traders can identify potential trend reversals or corrective moves. However, it is crucial to consider other factors and use these indicators in conjunction with other analysis techniques for effective trading decisions.
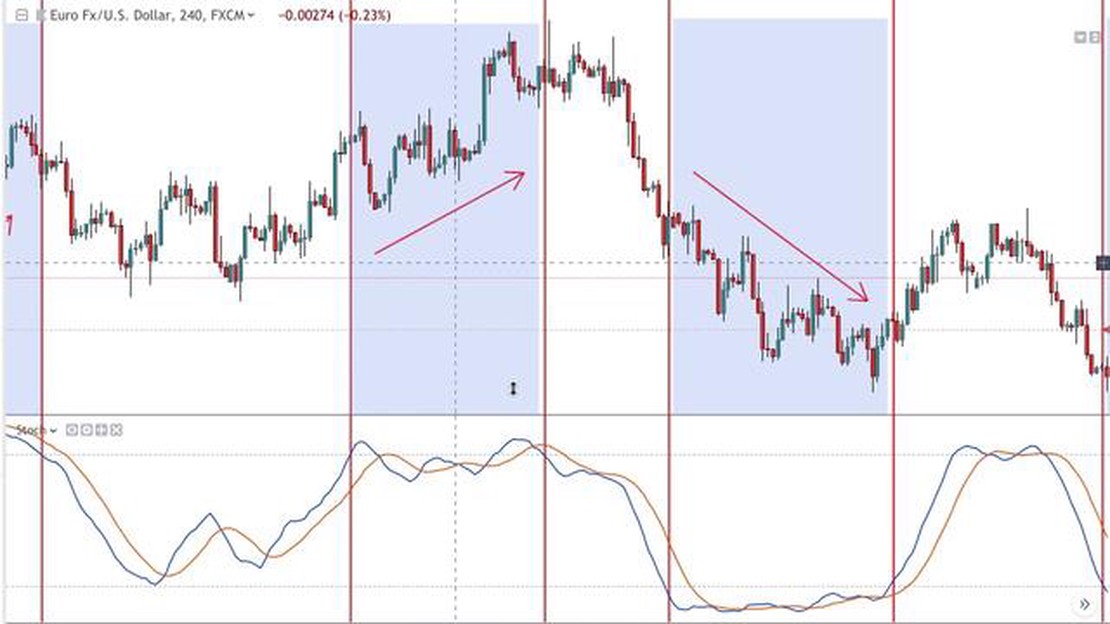
Indicator analysis is a crucial aspect of technical analysis when trading in financial markets. It involves studying various indicators to identify potential overbought and oversold conditions in an asset’s price.
By using indicators, traders can gain insight into market trends, momentum, and potential reversals. These indicators can help to provide a more comprehensive view of market conditions and can be used alongside other analysis techniques to make informed trading decisions.
One of the primary reasons indicator analysis is important is that it helps traders identify overbought and oversold conditions. Overbought conditions occur when an asset’s price has risen too far and too fast, potentially indicating that the price may soon reverse. Oversold conditions, on the other hand, occur when an asset’s price has fallen too far and too fast, suggesting that a price reversal may be imminent.
Additionally, indicator analysis can provide valuable information on market momentum. Momentum refers to the strength and speed of price movements. By using momentum indicators, traders can determine whether the current trend is likely to continue or if a reversal is likely to occur.
Furthermore, indicator analysis can help traders identify potential entry and exit points. By using indicators in conjunction with other technical analysis tools, traders can identify optimal times to enter a trade or exit a position, potentially maximizing profits and minimizing losses.
Read Also: Choosing the Right Time Frame for Trading: A Comprehensive Guide
It is important to note that no single indicator is foolproof and should be used in isolation. Traders should consider using a combination of indicators and analyze them in the context of broader market conditions. This approach can help to provide a more accurate picture of the market and improve trading decisions.
In conclusion, indicator analysis plays a crucial role in identifying overbought and oversold conditions and providing valuable insights into market trends and potential reversals. By utilizing indicators alongside other technical analysis methods, traders can make more informed trading decisions and increase their chances of success in the financial markets.
The best indicator to use for identifying overbought and oversold conditions is the relative strength index (RSI). RSI is a popular momentum oscillator that measures the speed and change of price movements. It ranges from 0 to 100 and is typically used to determine when an asset is overbought or oversold.
The RSI compares the magnitude of recent gains to recent losses in order to determine if an asset is overbought or oversold. When the RSI is above 70, it suggests that the asset is overbought and may be due for a price correction. Conversely, when the RSI is below 30, it suggests that the asset is oversold and may be due for a price bounce.

Yes, there are other indicators that can be used to identify overbought and oversold conditions. Some popular ones include the stochastic oscillator, the Williams %R, and the MACD (moving average convergence divergence). These indicators also measure momentum and can provide valuable insights into overbought and oversold levels.
You can use the RSI to make trading decisions by looking for divergences between the RSI and price movements. For example, if an asset is making higher highs in price, but the RSI is making lower highs, it could indicate that the asset is losing momentum and may be due for a price reversal. Similarly, if an asset is making lower lows in price, but the RSI is making higher lows, it could indicate that the asset is gaining momentum and may be due for a price increase.
Yes, it is possible for an asset to remain overbought or oversold for an extended period of time. While overbought and oversold conditions can be useful for identifying potential price reversals, they are not always reliable signals on their own. It is important to use overbought and oversold conditions in conjunction with other technical analysis tools and indicators to confirm potential trading opportunities.
An overbought condition occurs when the price of an asset has risen too high and is due for a correction. It indicates that the buying pressure has pushed the price to an unsustainable level.
An oversold condition occurs when the price of an asset has fallen too low and is due for a rebound. It indicates that the selling pressure has pushed the price to an excessively low level.

Reasons Companies Grant Stock Options Stock options are a form of compensation that many companies offer to their employees. It is a popular incentive …
Read Article
5 Effective ways to identify a trend in trading Spotting trends in trading is a crucial skill for any investor or trader. Being able to identify and …
Read Article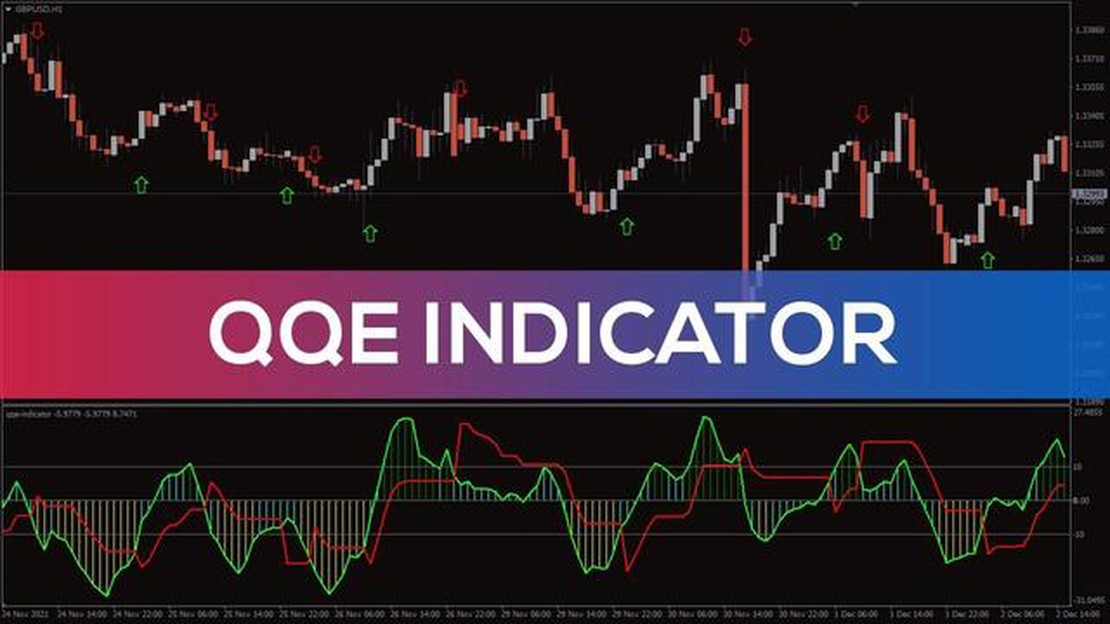
Understanding the QQE Signals Indicator MT4: A Comprehensive Guide When it comes to trading in the forex market, accurate trading signals can make all …
Read Article
What is the value of 0.01 lot in forex in dollars? Forex trading is a complex and dynamic market where currencies are bought and sold. Traders use …
Read Article
Understanding the 50-Smoothed Moving Average The 50 Smoothed Moving Average (SMA) is a key technical indicator used by traders and investors to …
Read Article
Is Selling Call Options a Profitable Strategy? Is Selling Call Options a Beneficial Strategy? Find Out Here Table Of Contents The Basics of Call …
Read Article


