


Understanding the Grant Date for Incentive Stock Options
Grant Date for Incentive Stock Options: What You Need to Know When it comes to incentive stock options (ISOs), the grant date plays a crucial role in …
Read Article

The 50 Smoothed Moving Average (SMA) is a key technical indicator used by traders and investors to understand market trends and make informed trading decisions. A moving average is a calculation that helps to smooth out price data over a specified period of time, allowing traders to identify trends and potential reversals.
The 50 SMA is especially significant because it is based on a longer time period compared to shorter-term moving averages. It provides a more comprehensive view of the market and is widely used by both short-term and long-term traders. By smoothing out price data over 50 periods, the 50 SMA can help to filter out short-term noise and focus on the broader trend.
Traders use the 50 SMA in various ways. One common strategy is to look for crossovers between the price and the 50 SMA. When the price crosses above the 50 SMA, it may signal a bullish trend and provide a buying opportunity. On the other hand, when the price crosses below the 50 SMA, it may indicate a bearish trend and suggest a selling opportunity.
Additionally, traders may use the 50 SMA as a dynamic support or resistance level. In an uptrend, the 50 SMA can act as a support level where buyers are likely to step in and push prices higher. In a downtrend, the 50 SMA can function as a resistance level where sellers may emerge and push prices lower. This knowledge can help traders identify potential entry and exit points.
Overall, the 50 Smoothed Moving Average is a powerful tool for technical analysis. It helps traders identify trends, filter out noise, and make informed trading decisions. By using the 50 SMA in conjunction with other technical indicators and analysis techniques, traders can gain a deeper understanding of the market and increase their chances of success.
Technical analysis is a vital tool for traders in the financial markets. It involves studying and analyzing past market data, such as price and volume, to forecast future price movements. This analysis helps traders make informed decisions about buying and selling financial assets.

One of the key benefits of technical analysis is that it provides traders with a systematic approach to analyzing the markets. By using various technical indicators and chart patterns, traders can gain insights into market trends and potential price reversals. This can help them identify entry and exit points for their trades.
Technical analysis also helps traders to manage risk effectively. By analyzing historical price data, traders can identify support and resistance levels, which are key levels where prices tend to reverse. This knowledge allows traders to set stop-loss orders and take-profit targets to limit their potential losses and maximize their profits.
Additionally, technical analysis can be used to validate fundamental analysis. Fundamental analysis involves studying the financial health and prospects of a company, while technical analysis focuses on price patterns and market trends. By combining these two approaches, traders can make more informed trading decisions.
Read Also: Who did the Bruins lose in free agency? See the key departures of Boston Bruins.
It is worth noting that technical analysis is not a guaranteed prediction of future price movements. It is a tool that traders use to assess the probability of certain outcomes based on historical data. Therefore, traders should use technical analysis in conjunction with other tools and strategies to make well-informed trading decisions.
In conclusion, technical analysis plays a crucial role in trading by providing traders with insights into the market and helping them make informed decisions. It helps traders analyze market trends, manage risk, and validate their trading strategies. Traders should take the time to learn and understand technical analysis to improve their trading skills and increase their chances of success in the financial markets.
The 50 Simple Moving Average (SMA) is a widely used technical indicator in the field of technical analysis. It is a moving average line that is calculated to smooth out price fluctuations and identify potential trends in the market.
The 50 SMA is calculated by summing up the closing prices of the last 50 trading periods and then dividing it by 50. This calculation is performed for each period, resulting in a moving average line that represents the average price over the past 50 periods.
The 50 SMA is commonly used by traders and investors to determine the overall direction of a particular security or market. It helps identify potential support and resistance levels and can be used as a signal for buying or selling opportunities.
When the price of a security is above the 50 SMA, it is often considered as a bullish signal, indicating that the market is in an uptrend. Conversely, when the price is below the 50 SMA, it is seen as a bearish signal, suggesting that the market is in a downtrend.
Read Also: Understanding the mechanics of spread betting trading
Traders often use the 50 SMA in conjunction with other technical indicators to confirm trading signals and make informed trading decisions. By analyzing the relationship between the price and the 50 SMA, traders can gain valuable insights into the market’s sentiment and make more accurate predictions of future price movements.
It is important to note that the 50 SMA is just one of many moving average indicators used in technical analysis. It provides a simple yet effective tool for identifying trends and potential support/resistance levels in the market. However, it should not be relied upon as the sole decision-making factor in trading, as market conditions can change rapidly and other factors should also be considered.
In conclusion, the 50 SMA is a powerful tool in technical analysis that helps traders and investors identify trends and potential trading opportunities. By understanding its definition and calculation, traders can incorporate this indicator into their analysis and make more informed trading decisions.

The 50 Smoothed Moving Average is a technical indicator that calculates the average price of an asset over the past 50 periods, while giving more weight to the most recent prices.
You can use the 50 Smoothed Moving Average as a trend-following tool to identify the direction of the market. If the price is above the 50 SMA, it indicates an uptrend, and if the price is below the 50 SMA, it indicates a downtrend.
The 50 Smoothed Moving Average gives more weight to recent prices, making it more responsive to changes in the market compared to the 50 Simple Moving Average. It smooths out price fluctuations and provides a clearer trend indication.
Yes, the 50 Smoothed Moving Average can be used in combination with other indicators to enhance your trading strategy. For example, you can use it in conjunction with the 200 SMA to confirm the strength of a trend.

Grant Date for Incentive Stock Options: What You Need to Know When it comes to incentive stock options (ISOs), the grant date plays a crucial role in …
Read Article
Trading Hours for CET: Everything You Need to Know When it comes to trading in the Central European Time (CET) zone, it’s crucial to understand the …
Read Article
What are the Four Seasons of Forex Market? When it comes to trading on the forex market, understanding the different seasons can make a significant …
Read Article
Ownership of Tadawul: Exploring the Key Stakeholders and Investors The Tadawul, also known as the Saudi Stock Exchange, holds a crucial role in the …
Read Article
Foreign Exchange Gains and Losses on Fixed Assets: Treatment and Implications When a company operates in multiple countries, it is often exposed to …
Read Article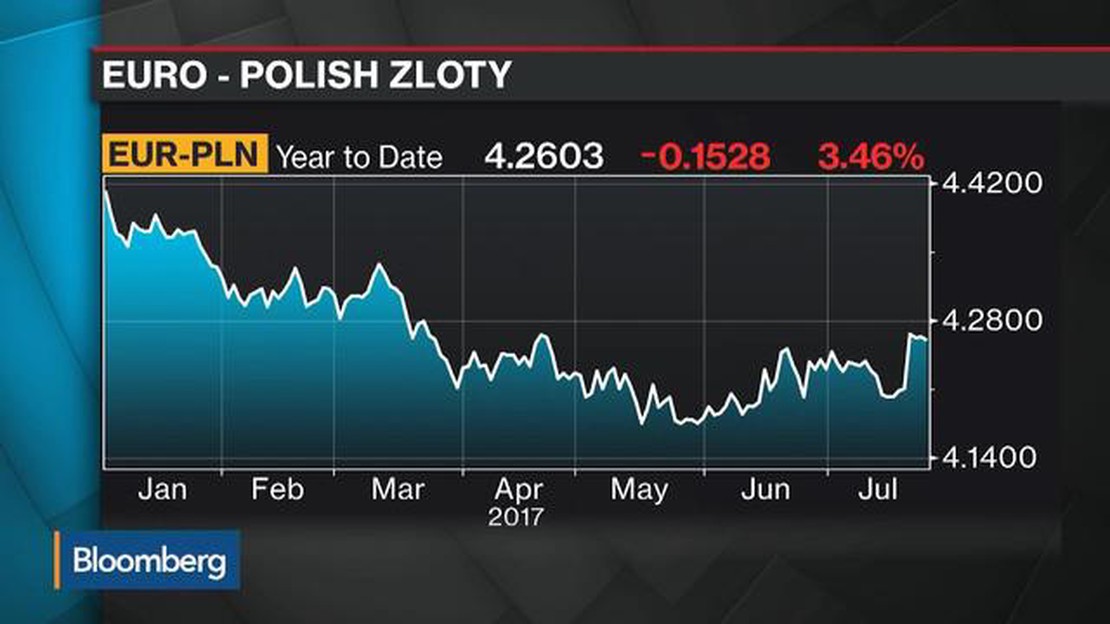
Reasons for the Strengthening of the Zloty The Zloty, the national currency of Poland, has been experiencing a significant strengthening in recent …
Read Article


