


Current exchange rate of NT to USD - Find out the latest rates
Exchange Rate for NT to USD Are you looking to exchange New Taiwan Dollars (NT) to United States Dollars (USD)? Stay up-to-date with the latest …
Read Article
Volatility is a key concept in finance that measures the amount of uncertainty or risk associated with a financial instrument or a market. It is an important tool for investors and traders to assess the potential returns and risks of their investments. By calculating volatility, investors can get a better understanding of the potential price movements of a stock, bond, or any other financial asset.
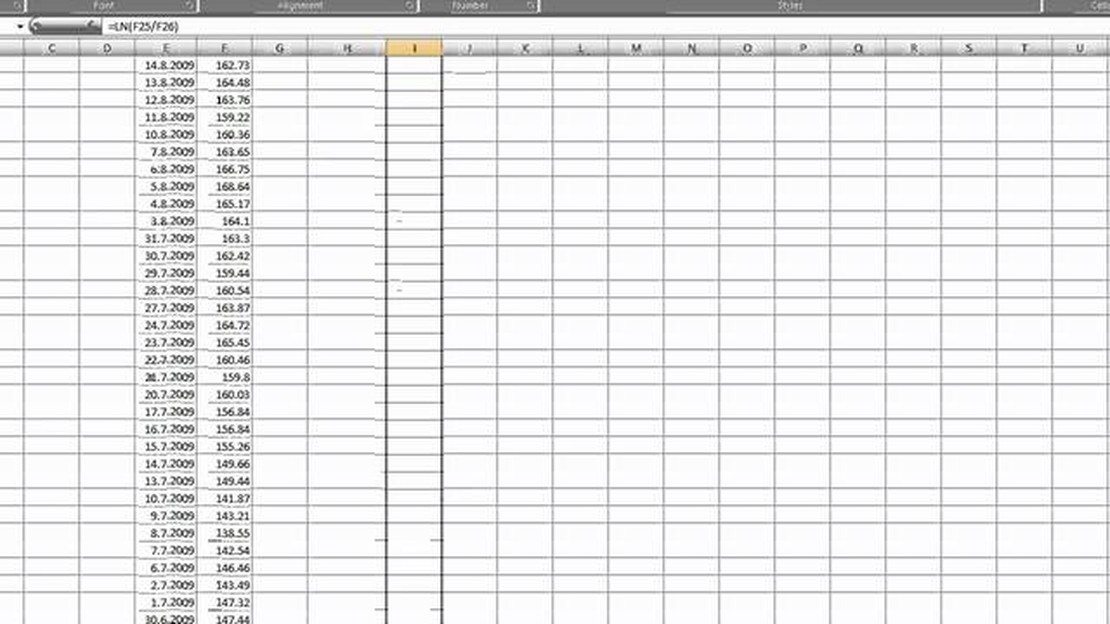
Calculating volatility involves a series of steps, which we will outline in this step-by-step guide. First, it is important to understand that volatility is usually measured using standard deviation. Standard deviation measures the dispersion of a set of data points from its mean. In the context of finance, it measures the spread of prices or returns from their average value over a given period of time.
To calculate volatility, you will need historical price data for the financial instrument or market you are analyzing. The more data points you have, the better your estimation of volatility will be. Once you have the historical price data, the first step is to calculate the average price or return over the chosen period. This will serve as the mean for calculating the standard deviation.
Next, subtract the mean from each individual data point to get the deviation. Square each deviation and calculate their sum. Divide the sum of squares by the number of data points, then take the square root of the result. This will give you the standard deviation, which represents the volatility of the financial instrument or market.
It is important to note that there are different ways to calculate volatility, such as using logarithmic returns or different timeframes. The method you choose will depend on your specific needs and preferences. Additionally, volatility is just one factor to consider when making investment decisions. It is always recommended to conduct thorough research and seek professional advice before making any financial decisions.
In conclusion, calculating volatility is an essential tool for investors and traders to assess the risk and potential returns of a financial instrument or market. By understanding the steps involved in calculating volatility, investors can make more informed decisions and manage their portfolios effectively.
Volatility is a measure of how much the price of a financial instrument, such as a stock or a currency, fluctuates over time. It is an important concept in financial markets as it indicates the level of uncertainty or risk associated with an investment or trading opportunity.
In general, higher volatility implies greater price fluctuations, which can be both advantageous and disadvantageous for investors. On one hand, it presents opportunities for higher returns through increased price movements. On the other hand, it also exposes investors to greater risk, as prices can move in unpredictable ways.

Volatility is often calculated using statistical measures such as standard deviation or variance. These measures quantify the dispersion of price data points around a mean or average price. A higher standard deviation or variance indicates higher volatility.
Volatility can be influenced by various factors including economic news, market conditions, geopolitical events, and investor sentiment. For example, an unexpected economic announcement or a significant political event can lead to a spike in volatility as market participants react to new information.
Traders and investors use volatility measurements to assess the level of risk associated with a particular investment. It helps them in determining the appropriate position sizing and risk management strategies. They may also use volatility to identify potential trading opportunities, such as breakouts or trend reversals.
Understanding volatility is crucial for anyone involved in financial markets, whether you are an individual investor, a professional trader, or a financial institution. It allows you to make more informed decisions, manage risks effectively, and capitalize on market opportunities.
Volatility is a statistical measure that quantifies the degree of variation in the price of a financial asset over time. It reflects the frequency and magnitude of price fluctuations. In other words, volatility measures how much the price of an asset deviates from its average over a specific period.
Read Also: How to Buy Iraqi Dinar: A Comprehensive Guide for Investors
Volatility is an important concept in finance and investing for several reasons:
Overall, understanding and measuring volatility is essential for investors and traders to make informed decisions, manage risk, and optimize their investment strategies.
Read Also: Latest Buying Rate of Euro Today: Discover the Current Exchange Rate
In order to calculate volatility, it is important to first gather the necessary data. This data typically consists of historical price information for the asset or security in question. Gathering this data can be done in a number of ways, including:
1. Market Data Providers: Many financial news websites and platforms provide historical price data for various assets and securities. These providers often offer the option to download the data in a format that can be easily imported into analysis software.
2. Online Databases: There are various online databases that offer historical price data for a wide range of assets and securities. These databases often provide the data in a downloadable format and may also offer additional tools for analyzing the data.
3. Trading Platforms: Some trading platforms have built-in tools that allow users to access and download historical price data for the assets and securities that are available for trading on the platform. These tools can be useful for traders who already use the platform for trading purposes.
4. Data Providers: There are third-party data providers that specialize in providing historical price data for a wide range of assets and securities. These providers often offer more advanced data analysis tools and may also provide real-time data feeds.

Once the historical price data has been gathered, it is important to ensure that the data is accurate and complete. Any missing or inaccurate data can significantly affect the accuracy of the volatility calculations.
Note: It is important to keep in mind that calculating volatility requires a sufficient amount of historical data. The length of the historical data period used for calculations may vary depending on the asset or security being analyzed.
Volatility refers to the degree of variation of a financial instrument’s price over time. It is important to calculate volatility because it provides insight into the potential risk and profitability of an investment. Investors can use volatility to make informed decisions about their investment strategies and to assess the likelihood of significant price movements.
There are several types of volatility measures, including historical volatility, implied volatility, and realized volatility. Historical volatility calculates the standard deviation of past price changes, while implied volatility reflects the market’s expectations for future price fluctuations. Realized volatility is based on actual price movements within a specific time frame.
To calculate historical volatility, you need to gather a historical price dataset for the financial instrument you are interested in. Then, calculate the percentage change in prices from one period to the next. Next, calculate the annualized standard deviation of these percentage changes. Finally, multiply the result by the square root of the number of periods in a year to get the annualized historical volatility.
Implied volatility reflects the market’s expectations for future price movements. It is calculated using an option pricing model, such as the Black-Scholes model. The model takes into account factors such as the current price of the underlying asset, the option’s strike price, time to expiration, interest rates, and dividends to estimate the implied volatility.
While volatility can provide insights into the potential range of price movements, it is not a direct predictor of future price movements. Volatility measures the degree of variation in prices, but it does not indicate the direction of price changes. Other factors, such as market conditions, fundamental analysis, and investor sentiment, also play a role in determining future price movements.

Exchange Rate for NT to USD Are you looking to exchange New Taiwan Dollars (NT) to United States Dollars (USD)? Stay up-to-date with the latest …
Read Article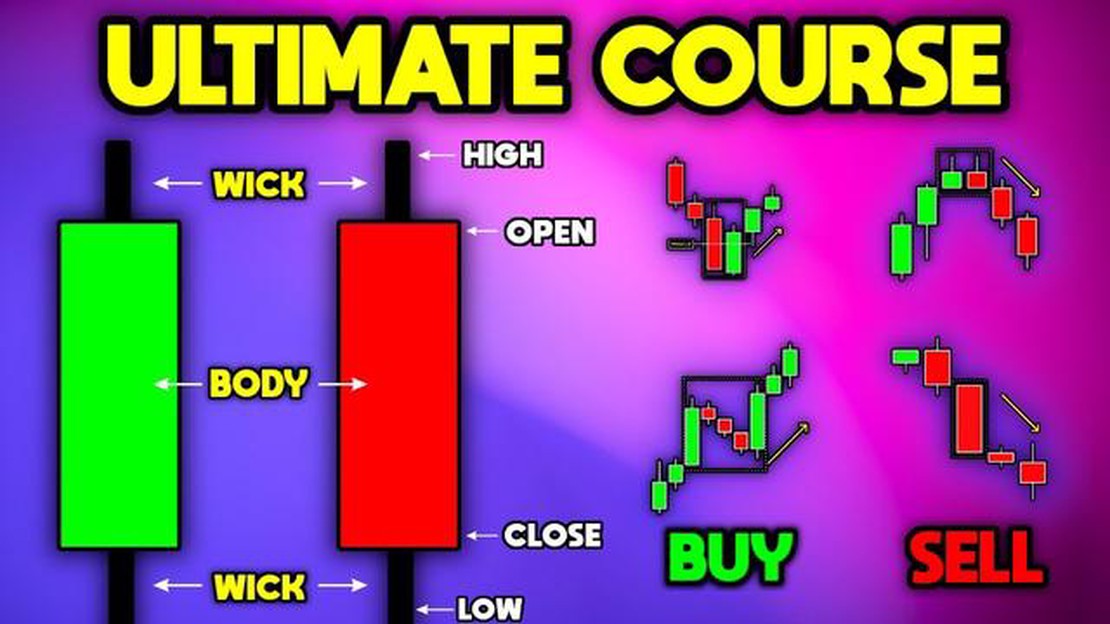
Types of Hammers in Forex: A Comprehensive Guide Forex trading involves the buying and selling of currencies in order to make a profit. This financial …
Read Article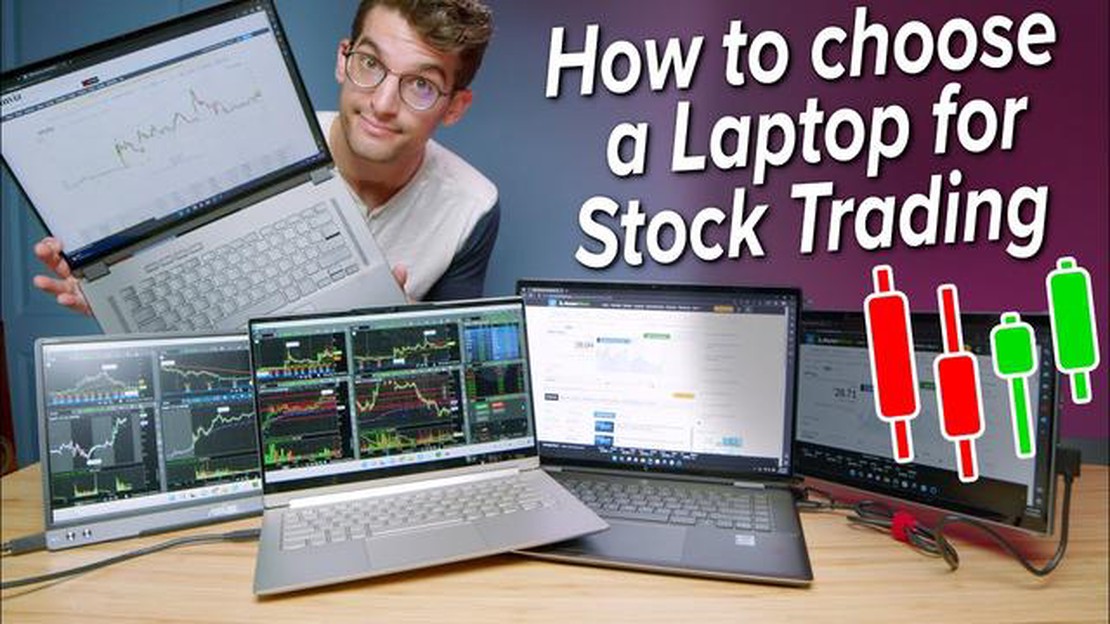
Best Computers for Trading Stocks: A Comprehensive Guide When it comes to trading stocks, having the right computer can make all the difference. With …
Read Article
Best US options trading platform from UK Are you a UK trader looking to invest in the US options market? Finding the right trading platform that suits …
Read Article
Understanding the CAC 40 Index Sector: An Overview The CAC 40 Index is a benchmark stock market index that represents the performance of the 40 …
Read Article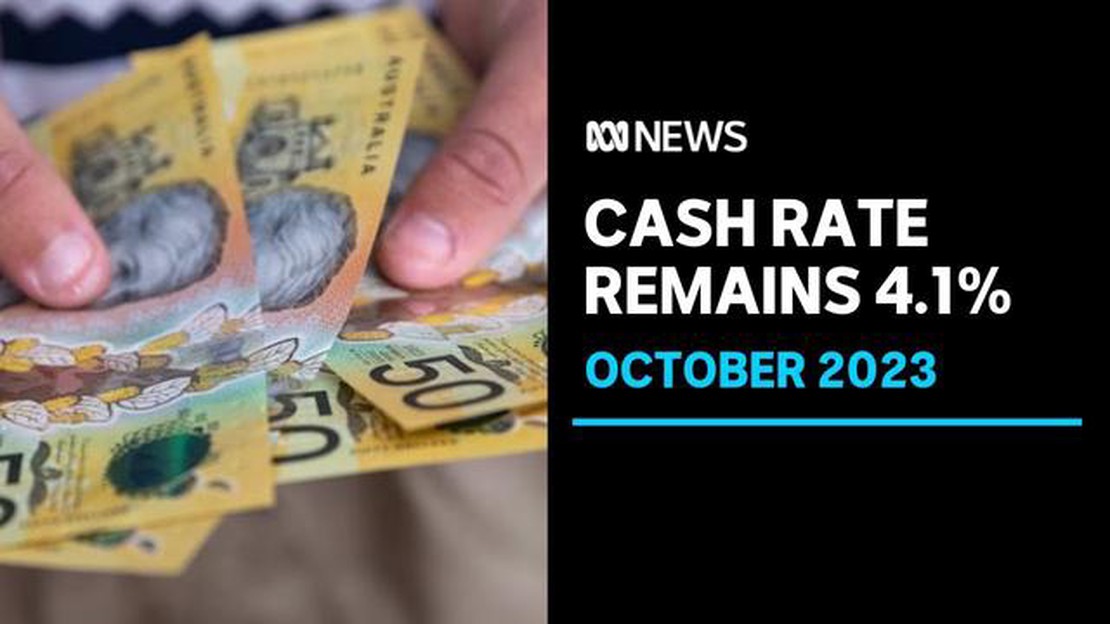
What is the total holdings of the RBA? The Reserve Bank of Australia (RBA) is the country’s central bank and is responsible for a wide range of …
Read Article


