
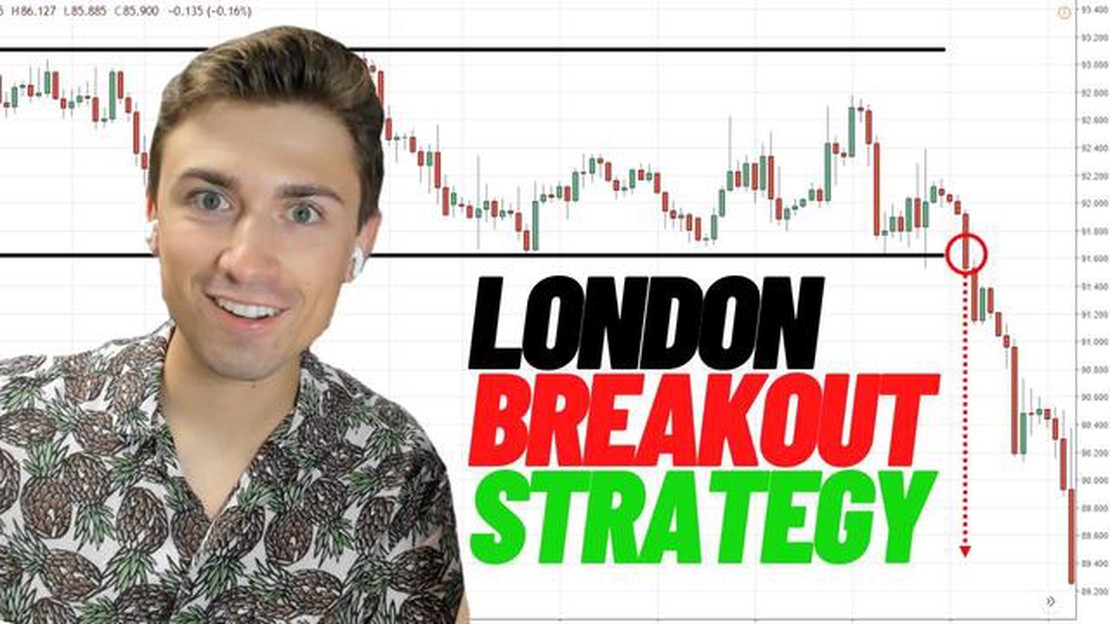

Mastering the London Breakout Strategy: Tips and Techniques
How to effectively use the London breakout strategy If you’re looking to take your forex trading to the next level, mastering the London Breakout …
Read Article
The 20-day and 200-day moving averages are popular technical analysis tools used by traders and investors to identify trends and make trading decisions. These moving averages are calculated by averaging the closing prices of a security over a specific period of time, typically 20 days and 200 days respectively.
The 20-day moving average is a short-term indicator that provides a more timely representation of price movements. It helps to smooth out short-term fluctuations and highlight the overall direction of the market. When the price crosses above the 20-day moving average, it is often seen as a bullish signal, indicating that the uptrend may continue. Conversely, when the price falls below the 20-day moving average, it can be interpreted as a bearish signal, suggesting that the downtrend may persist.
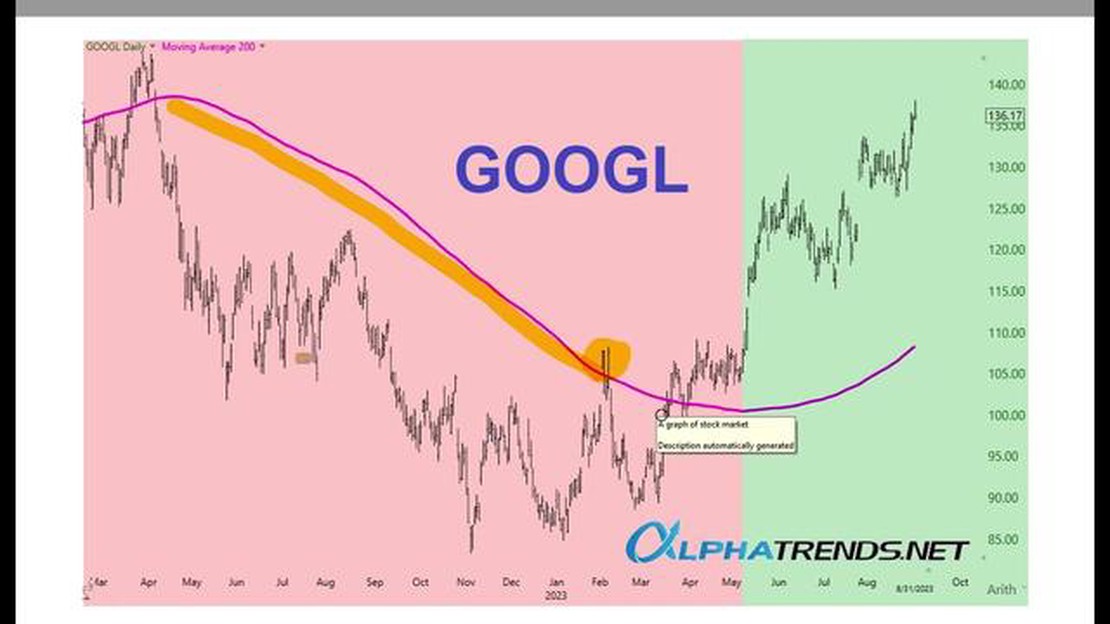
On the other hand, the 200-day moving average is a long-term indicator that acts as a support or resistance level for the price. It provides a broader perspective of the market trend and is typically used by long-term investors. When the price crosses above the 200-day moving average, it is considered a bullish signal, signaling the potential for a sustained uptrend. Conversely, when the price falls below the 200-day moving average, it is viewed as a bearish signal, indicating the possibility of a prolonged downtrend.
Traders and investors often use the combination of the 20-day and 200-day moving averages to confirm trends and make trading decisions. When the 20-day moving average crosses above the 200-day moving average, it is called a “golden cross” and is considered a strong bullish signal. Conversely, when the 20-day moving average crosses below the 200-day moving average, it is known as a “death cross” and is viewed as a strong bearish signal.
In conclusion, the 20-day and 200-day moving averages are powerful tools that help traders and investors identify trends and make informed trading decisions. By understanding how these moving averages work and how they are interpreted, you can gain valuable insights into the market and improve your trading strategies.
The 20-day and 200-day moving average are technical indicators that help traders and investors understand the overall trend of a stock or financial instrument. These moving averages are calculated by averaging the closing prices of the stock over a specific number of days.
The 20-day moving average represents the short-term trend of the stock. It provides a smoother line that filters out the day-to-day price fluctuations, giving traders a clearer view of the stock’s direction. If the stock price is consistently above the 20-day moving average, it suggests bullish sentiment, indicating that the stock is in an uptrend. Conversely, if the stock price is consistently below the 20-day moving average, it suggests bearish sentiment, indicating that the stock is in a downtrend.

The 200-day moving average represents the long-term trend of the stock. It provides a more stable line that smoothens out the short-term volatility. Traders and investors often use the 200-day moving average as a reference point to determine the overall health of the stock. If the stock price is trading above the 200-day moving average, it suggests a bullish market sentiment, indicating that the stock is in a long-term uptrend. On the other hand, if the stock price is trading below the 200-day moving average, it suggests a bearish market sentiment, indicating that the stock is in a long-term downtrend.
By using both the 20-day and 200-day moving averages together, traders and investors can gain a comprehensive understanding of the stock’s trend. If the 20-day moving average crosses above the 200-day moving average, it is considered a bullish signal, indicating a potential trend reversal to the upside. Conversely, if the 20-day moving average crosses below the 200-day moving average, it is considered a bearish signal, indicating a potential trend reversal to the downside.
It is important to note that moving averages are lagging indicators, meaning they are based on historical data and may not accurately predict future price movements. Traders and investors often use additional technical analysis tools and strategies in conjunction with moving averages to make informed trading decisions.
The 20-day moving average is a technical indicator used in financial markets to analyze the price trend of an asset over a 20-day period. It is calculated by adding up the closing prices of the asset for the past 20 days and dividing the sum by 20. The resulting average is then plotted on a chart to visualize the overall direction of the asset’s price movement.
This moving average is commonly used by traders and investors to identify short-term price trends and to determine potential support and resistance levels. It provides a smoothed line on the chart that helps filter out market noise and provides a clearer picture of the asset’s price trajectory.
Read Also: Margin on NSE Options: Understanding the Basics and Calculating Margins
The 20-day moving average is often used in conjunction with other moving averages, such as the 200-day moving average, to generate trading signals and confirm the strength of a trend. When the price of an asset crosses above the 20-day moving average, it is considered a bullish signal, indicating that the upward momentum may continue. Conversely, when the price crosses below the 20-day moving average, it is seen as a bearish signal, suggesting that the downward trend may continue.
It is important to note that moving averages are lagging indicators, meaning they are based on past price data and may not accurately predict future price movements. They are best used as part of a comprehensive trading strategy that incorporates other technical indicators and fundamental analysis.
Read Also: Who owns IronFX: A Detailed Look at the Ownership of the Forex Broker
The 200-day moving average is a commonly used technical indicator in the financial markets. It is calculated by taking the average closing price of a security over the past 200 trading days. This moving average is often used by traders and investors to identify the overall trend of a stock or other financial instrument.
The 200-day moving average is considered a long-term indicator and is often used in conjunction with shorter-term moving averages, such as the 20-day moving average, to provide a more comprehensive view of the market. When the price of a security is above its 200-day moving average, it is often seen as a bullish signal, indicating that the stock is in an upward trend. Conversely, when the price falls below the 200-day moving average, it is seen as a bearish signal, suggesting that the stock is in a downward trend.
| Advantages | Disadvantages |
|---|---|
| 1. Provides a smooth average that filters out short-term price fluctuations. | 1. Can lag behind significant price changes. |
| 2. Helps to identify long-term trends. | 2. May produce false signals in volatile markets. |
| 3. Widely used and understood by traders. | 3. Can be less effective in fast-moving markets. |
Traders often use the 200-day moving average as a reference point for determining support and resistance levels. A stock that bounces off its 200-day moving average and starts moving higher can be considered as finding support, while a stock that fails to hold above the 200-day moving average can be seen as facing resistance.
It’s important to note that the 200-day moving average is just one tool among many that traders use to analyze the market. It is not infallible and should be used in conjunction with other technical indicators and analysis methods.

In conclusion, the 200-day moving average is a widely used long-term indicator that helps traders and investors identify the overall trend of a stock or other financial instrument. It can be used to determine support and resistance levels and is often used in conjunction with other indicators to provide a more comprehensive view of the market.
A moving average is a widely used statistical calculation that is used to analyze data over a certain period of time. It helps to smoothen out short-term fluctuations and provide a clearer picture of the overall trend.
The 20-day moving average is a calculation that takes the closing prices of an asset over the past 20 trading days and averages them. It is often used by traders and investors to identify the short-term trend of a stock or index.
The 200-day moving average is a calculation that takes the closing prices of an asset over the past 200 trading days and averages them. It is often used by traders and investors to identify the long-term trend of a stock or index.
The 20-day moving average is calculated by adding up the closing prices of an asset over the past 20 trading days and then dividing the sum by 20. This calculation is performed each day to provide a moving average that reflects the most recent data.
The 200-day moving average is often used as a key indicator of the long-term trend in trading. When the price of an asset is above the 200-day moving average, it is considered bullish and indicates that the asset is in an uptrend. On the other hand, when the price is below the 200-day moving average, it is considered bearish and indicates that the asset is in a downtrend.

How to effectively use the London breakout strategy If you’re looking to take your forex trading to the next level, mastering the London Breakout …
Read Article
Trading has never been so accessible as it is today, thanks to the advancements in technology. With just a laptop and an internet connection, you have …
Read Article
Is options trading still profitable? If you are interested in financial markets and investing, chances are you have heard of options trading. Options …
Read Article
Setting up an Alert on Moving Average Setting alerts on moving averages can be a useful tool in keeping track of market trends and potential …
Read Article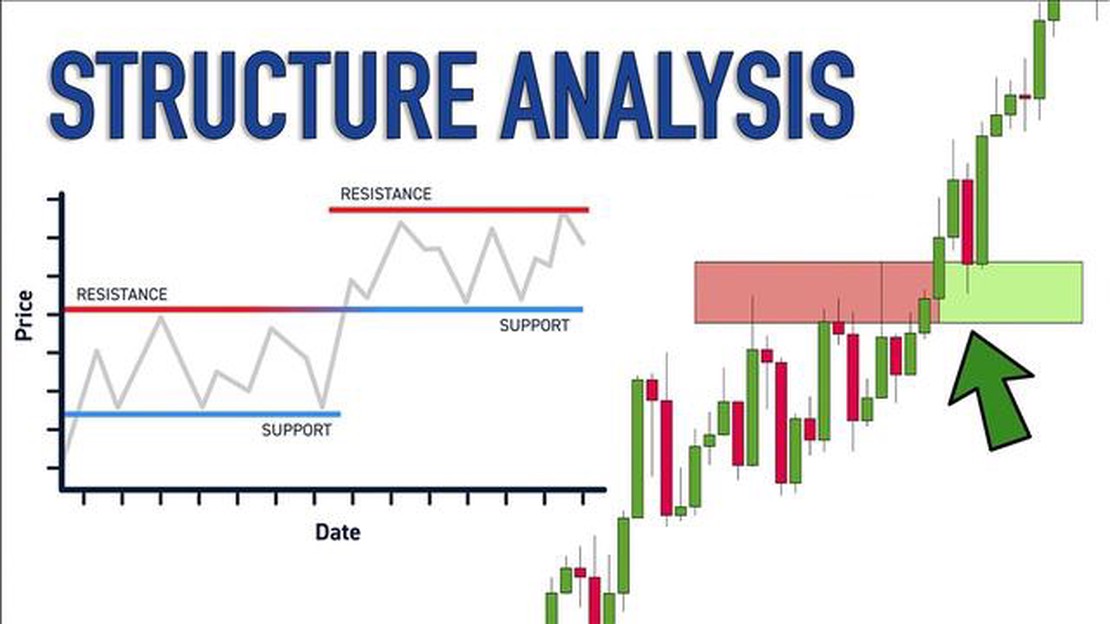
Understanding the Support Level of Gold Gold has long been considered a safe-haven investment, providing stability and security in times of economic …
Read Article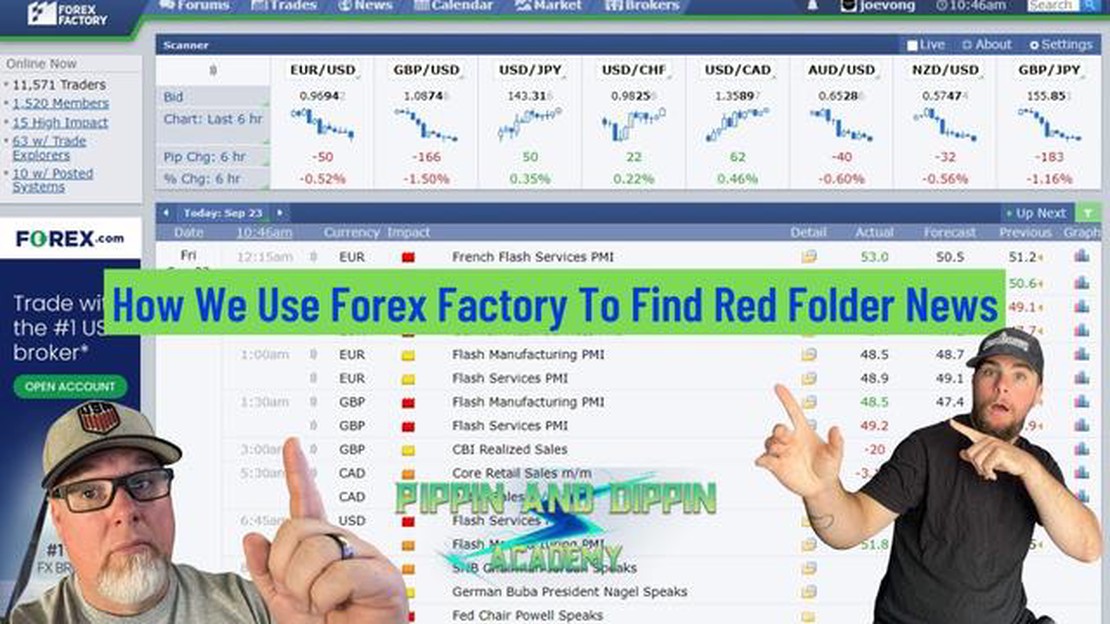
What does red folder mean in Forex Factory? Forex Factory is a popular online platform for forex traders to exchange information, strategies, and …
Read Article


