
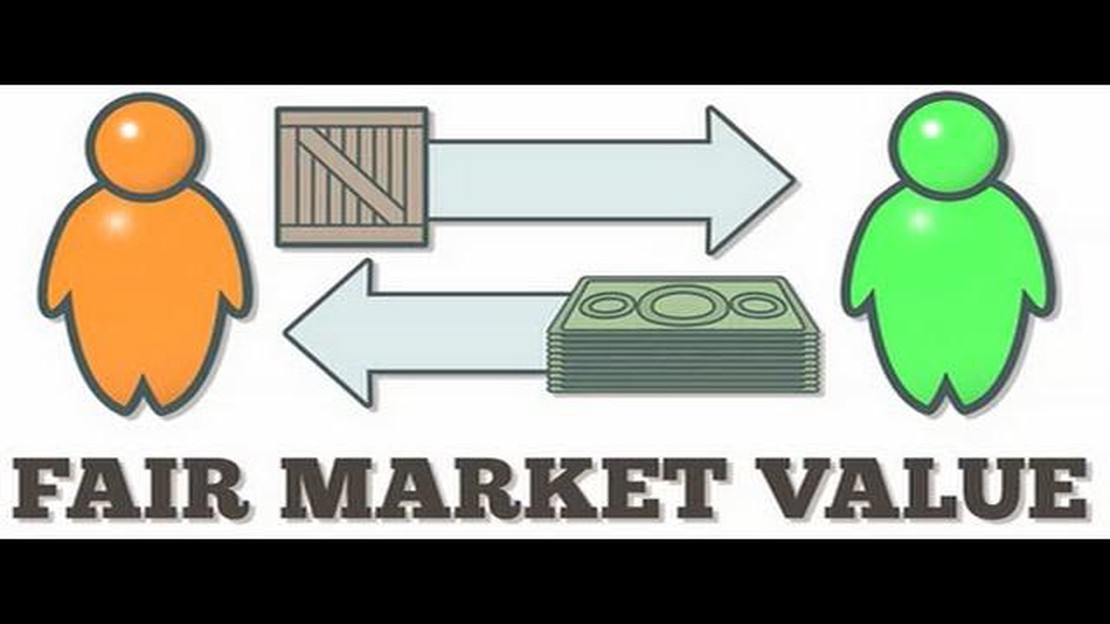

Is Fair Market Value the Same as Share Price? Understanding the Difference
Understanding the Difference Between Fair Market Value and Share Price When it comes to investing in stocks, understanding the difference between fair …
Read Article
The 50 and 200-day moving average indicators are widely used tools in technical analysis for predicting future price trends of stocks and other financial instruments. These indicators are based on the calculation of the average price over a certain period of time and are commonly used by traders and investors to identify potential buying or selling opportunities.
The 50-day moving average is a short-term indicator that calculates the average price of a security over the past 50 trading days. It is often used to identify short-term trends and determine potential support or resistance levels. When the price of a security crosses above the 50-day moving average, it is considered a bullish signal, indicating that the stock may continue to rise. Conversely, when the price crosses below the 50-day moving average, it is seen as a bearish signal and suggests that the stock may continue to decline.
The 200-day moving average is a long-term indicator that calculates the average price of a security over the past 200 trading days. It is commonly used to identify long-term trends and determine the overall direction of the market. Similar to the 50-day moving average, when the price crosses above the 200-day moving average, it is seen as a bullish signal. Conversely, when the price crosses below the 200-day moving average, it is considered a bearish signal.
By analyzing the relationship between the 50 and 200-day moving averages, traders and investors can gain insights into the strength and sustainability of a trend. If the 50-day moving average crosses above the 200-day moving average, it is known as a “golden cross” and is considered a strong bullish signal. On the other hand, if the 50-day moving average crosses below the 200-day moving average, it is known as a “death cross” and is seen as a strong bearish signal.
It’s important to note that moving averages are lagging indicators, which means that they are based on past price data and may not accurately predict future price movements. Therefore, it is crucial to use moving averages in conjunction with other technical analysis tools and indicators to make informed trading decisions.
In summary, the 50 and 200-day moving average indicators are valuable tools for traders and investors to identify potential trends and trading opportunities. Understanding the relationship between these indicators and their implications for market direction can assist in making more informed investment decisions. However, it’s important to remember that no indicator is foolproof, and it’s always wise to use multiple indicators and analysis techniques when making trading decisions.

The 50 and 200-day moving average indicator is a technical analysis tool commonly used by traders and investors to help them make informed decisions about buying or selling stocks. It is based on the simple concept of calculating the average price of a security over a specific time period, typically measured in days.
The 50-day moving average (50 DMA) represents the average price of a security over the past 50 trading days. The 200-day moving average (200 DMA) represents the average price of a security over the past 200 trading days. These moving averages are calculated by adding up the closing prices of the security for the specified time period and dividing by the number of days.
The 50 and 200-day moving averages are often used together to provide a comprehensive view of the security’s price trend. When the 50 DMA crosses above the 200 DMA, it is considered a bullish signal, indicating that the security’s price is likely to continue rising. Conversely, when the 50 DMA crosses below the 200 DMA, it is considered a bearish signal, indicating that the security’s price is likely to continue falling.
| Time Period | Description |
|---|---|
| 50-day moving average (50 DMA) | The average price of a security over the past 50 trading days |
| 200-day moving average (200 DMA) | The average price of a security over the past 200 trading days |
Traders and investors use the 50 and 200-day moving average indicator to identify trends and price levels that may signal potential trading opportunities. By comparing the current price of a security to its moving average, they can determine whether the security is trading above or below its average price, and make decisions accordingly.
It is important to note that the 50 and 200-day moving averages are lagging indicators, meaning that they are based on past data. As such, they may not provide timely signals for short-term traders or those looking to make quick profits. However, they can be useful tools for longer-term investors who are more interested in identifying long-term trends and staying invested in a security for an extended period of time.
Read Also: Understanding the Average PE Ratio of Nikkei 225: Exploring Japan's Stock Market
The 50 and 200-day moving averages are widely followed indicators used in technical analysis to understand the general trend of a stock’s price over a specified time period. These moving averages provide traders and investors with valuable insights into the market sentiment and can help them make more informed decisions.
The 50-day moving average is a short-term trend indicator that shows the average closing price of a security over the past 50 trading days. It is commonly used by traders to identify short-term trends and spot potential buy or sell signals. When the stock’s price is trading above the 50-day moving average, it suggests that the stock is in an uptrend, while trading below the 50-day moving average indicates a downtrend.
Read Also: What is the Simplest Option Strategy? Explained in Detail
The 200-day moving average, on the other hand, is a long-term trend indicator that smooths out price fluctuations over a longer period. It provides a broader perspective on the stock’s price trend and is considered more reliable in determining the overall trend of the market. Traders and investors often use the 200-day moving average to identify support and resistance levels, as well as to confirm trend reversals.
By comparing the 50-day and 200-day moving averages, traders can gain insights into the strength of a trend. When the 50-day moving average crosses above the 200-day moving average, it is known as a “golden cross” and indicates a bullish signal. This crossover suggests that the short-term trend is gaining strength and can potentially lead to further upside movement in the stock’s price. Conversely, when the 50-day moving average crosses below the 200-day moving average, it is called a “death cross” and signals a bearish trend. This crossover suggests that the short-term trend is weakening and could lead to further downside movement.
It is important to note that moving averages are lagging indicators, as they are based on historical data. They do not predict future price movements, but rather provide a visual representation of the overall trend. However, the 50 and 200-day moving averages are widely followed by traders and investors due to their simplicity and effectiveness in analyzing the market sentiment. Understanding and incorporating these indicators into one’s trading strategy can help improve decision-making and increase the chances of profitable trades.
The 50-day moving average calculates the average price of a security over the past 50 trading days, while the 200-day moving average calculates the average price over the past 200 trading days. The 50-day moving average is more responsive to short-term price movements, while the 200-day moving average is more reflective of long-term trends.
Traders can use the 50 and 200-day moving average indicator as a tool to identify potential entry and exit points for trades. When the 50-day moving average crosses above the 200-day moving average, it is considered a bullish signal, indicating a potential uptrend. Conversely, when the 50-day moving average crosses below the 200-day moving average, it is considered a bearish signal, indicating a potential downtrend.
One limitation of the 50 and 200-day moving average indicator is that it is a lagging indicator, meaning it is based on past price data and may not accurately predict future price movements. Additionally, this indicator may generate false signals during periods of market volatility or range-bound trading. It is important for traders to use other technical analysis tools and indicators in conjunction with the moving averages to make well-informed trading decisions.

The 50-day moving average is generally more volatile than the 200-day moving average. Since it calculates the average price over a shorter time period, it is more responsive to short-term price fluctuations. The 200-day moving average, on the other hand, smooths out these short-term fluctuations and provides a longer-term perspective on the price trend.
Yes, the 50 and 200-day moving average indicator can be used in combination with other technical indicators to enhance trading strategies. For example, traders may look for confirmation signals from other indicators, such as the relative strength index (RSI) or the moving average convergence divergence (MACD), before making trading decisions based on the moving averages. By using multiple indicators, traders can gain a more comprehensive understanding of the market and increase the accuracy of their predictions.
The 50-day moving average indicator is a technical analysis tool that calculates the average price of a security over the last 50 trading days. It is used to identify trends and predict future price movements.
The 200-day moving average indicator is similar to the 50-day moving average indicator, but it calculates the average price of a security over the last 200 trading days instead of 50. It is generally considered a longer-term indicator and is used to identify long-term trends.

Understanding the Difference Between Fair Market Value and Share Price When it comes to investing in stocks, understanding the difference between fair …
Read Article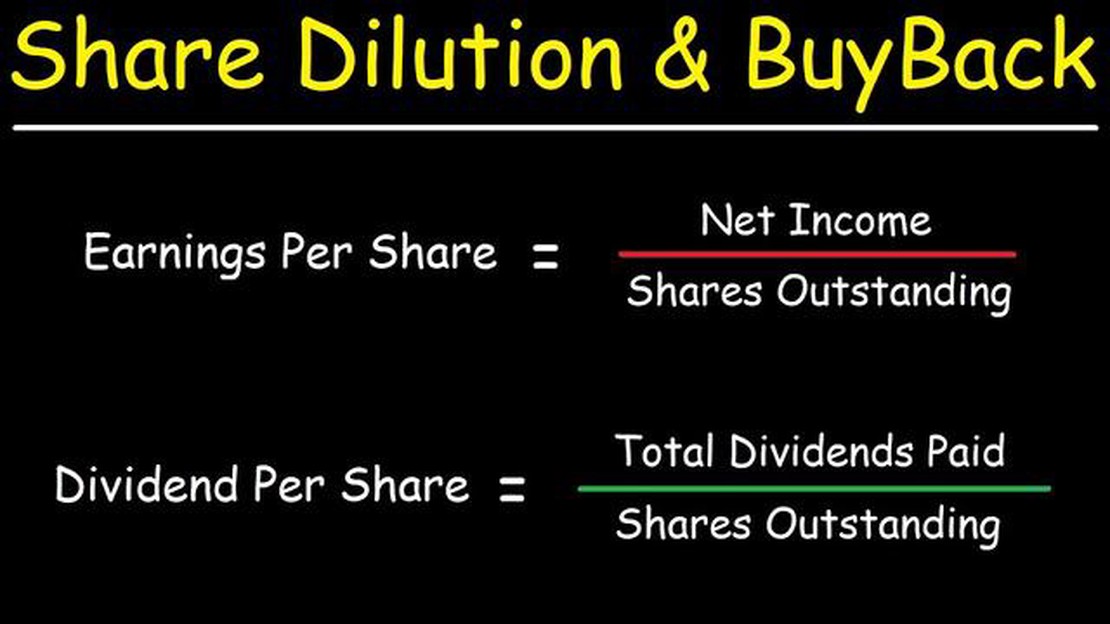
Impact of Dividends on Earnings per Share Earnings per share (EPS) is a financial ratio that measures the profitability of a company. It is calculated …
Read Article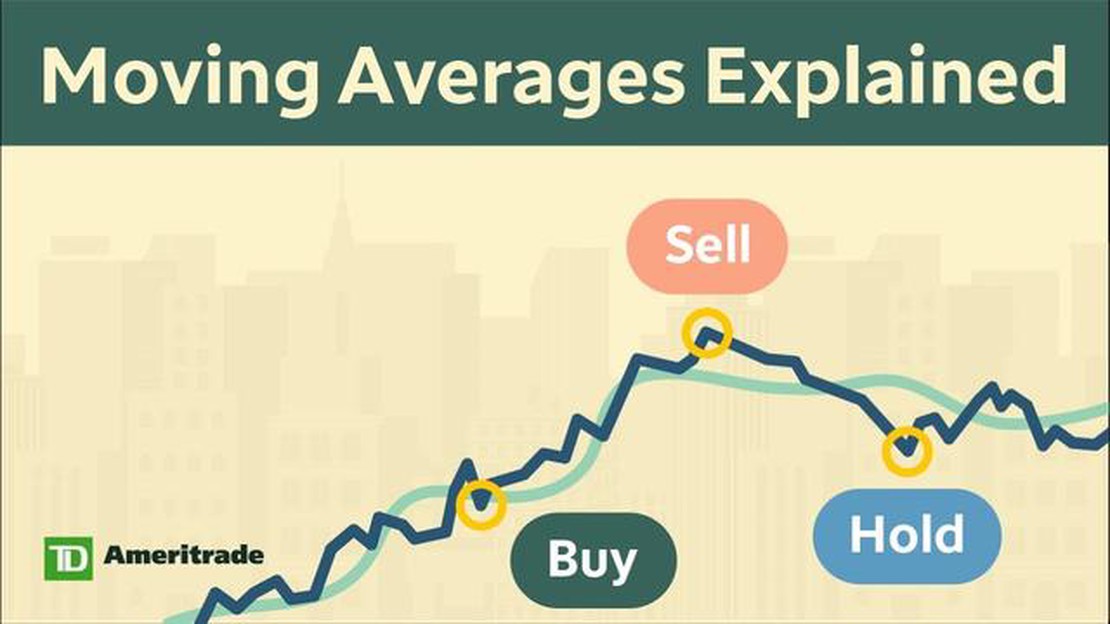
Discover the Advantages of Using Moving Averages in Your Calculations When it comes to analyzing data trends and making predictions, calculating a …
Read Article
Is Option Trading Open on Saturday and Sunday? Saturday and Sunday are commonly known as the weekend, a time for relaxation and enjoying time off from …
Read Article
Understanding the Importance of a High Long Short Ratio in Trading The long short ratio is an important metric for traders and investors to consider …
Read Article
Recovering Losses in Option Trading: Strategies and Tips Option trading can be a highly lucrative endeavor, but it also comes with its fair share of …
Read Article


