


Best Places to Exchange Currency in Kuala Lumpur
Where to Exchange Currency in Kuala Lumpur Kuala Lumpur, the capital city of Malaysia, is a vibrant metropolis known for its modern skyscrapers, rich …
Read Article
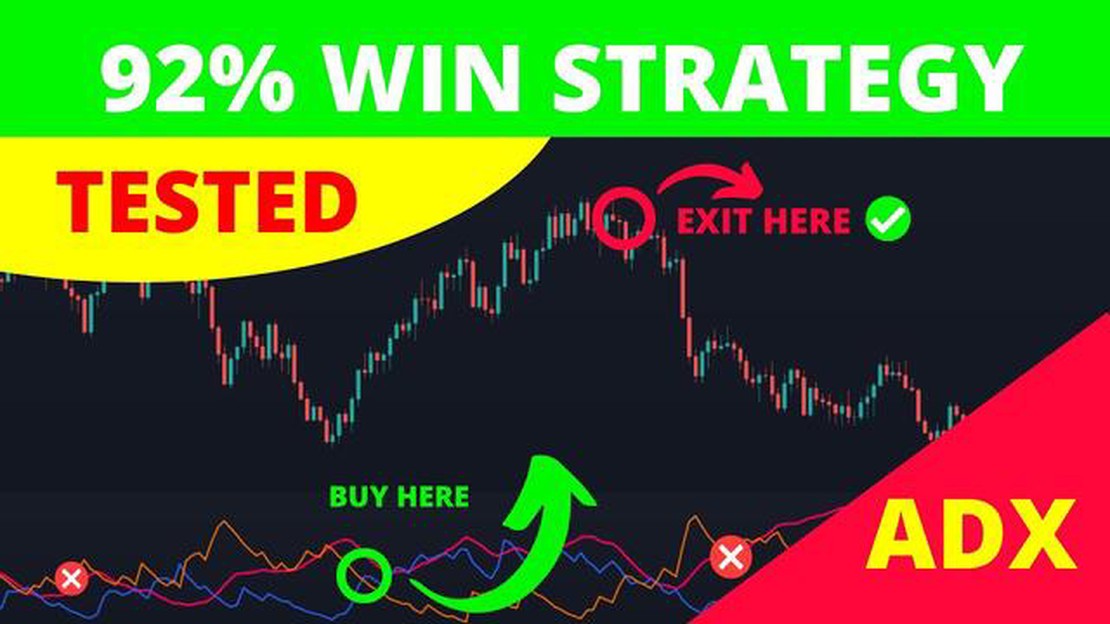
The Average Directional Index (ADX) is a technical analysis indicator used to determine the strength and direction of a trend. It is often used by traders to identify potential buy or sell signals in the market. When the ADX is below 20, it generally indicates that the market is ranging or experiencing a weak trend. In other words, there is not enough momentum or strength in either the bullish or bearish direction to generate a strong trend.
When the ADX is below 20, it can be a sign that the market is in a consolidation phase. This means that the price is moving within a narrow range and there is no clear trend in either direction. Traders may interpret this as a sign of indecision in the market and choose to stay on the sidelines until a stronger trend emerges.
However, it’s important to note that the ADX is not a standalone indicator and should be used in conjunction with other technical analysis tools. For example, traders may use other indicators such as moving averages or support and resistance levels to confirm the ADX signal. Additionally, the ADX value should be considered in the context of the overall market conditions and the timeframe being analyzed.
It’s worth mentioning that the interpretation of the ADX below 20 may vary among traders and analysts. Some may consider it a strong enough signal to enter or exit a trade, while others may require a higher threshold.
In conclusion, when the ADX is below 20, it generally indicates a weak trend or a ranging market. Traders should use this information in combination with other technical analysis tools and consider the overall market conditions before making any trading decisions.
ADX stands for Average Directional Index. It is a technical analysis indicator used to measure the strength of a trend. It was developed by J. Welles Wilder and introduced in his book “New Concepts in Technical Trading Systems” in 1978.
The ADX is calculated using a formula that involves a series of mathematical calculations. The formula is complex and involves several steps, but the end result is a numerical value that ranges from 0 to 100. The higher the ADX value, the stronger the trend.

The ADX is derived from two other indicators called the Positive Directional Indicator (+DI) and the Negative Directional Indicator (-DI). These indicators are used to measure the upward and downward movement of a security’s price over a given period of time.
The ADX is calculated by taking the difference between the +DI and -DI and dividing it by the sum of the +DI and -DI. This value is then multiplied by 100 to obtain a percentage. The ADX is a lagging indicator, meaning it is based on past price data and may not accurately predict future price movements.
The ADX is commonly used by traders and investors to determine the strength of a trend and identify potential buying and selling opportunities. A high ADX value indicates a strong trend, while a low ADX value indicates a weak trend or a range-bound market. Traders may use the ADX in conjunction with other indicators to make more informed trading decisions.
| + | - | +DI | -DI |
|---|---|---|---|
| Upward price movement | Downward price movement | Average of positive upward price movements | Average of negative downward price movements |
The Average Directional Index (ADX) is a technical indicator that is used to measure the strength of a trend. It was developed by J. Welles Wilder and it can help traders and investors identify whether a market is trending or ranging.
Read Also: Discovering the Currency in Switzerland: Everything You Need to Know
The calculation of the ADX involves three components - the Positive Directional Index (+DI), the Negative Directional Index (-DI), and the Average Directional Index itself.
First, the +DI is calculated by using the formula: (+DM / ATR) * 100, where +DM is the positive directional movement and ATR is the average true range. The +DI measures the strength of the positive movement in the market.
Second, the -DI is calculated by using the formula: (-DM / ATR) * 100, where -DM is the negative directional movement. The -DI measures the strength of the negative movement in the market.
Finally, the ADX is calculated by using the formula: (|(+DI - (-DI)) / (+DI + (-DI))|) * 100. The ADX value ranges from 0 to 100, with higher values indicating a stronger trend and lower values indicating a weaker trend.
Read Also: Is 30 Pips a Lot? Understanding the Value of a Pip in Forex Trading
The ADX is an important tool for technical analysis as it can provide valuable information about the trend strength and help traders make informed decisions. A high ADX value suggests that a market is trending strongly, while a low ADX value suggests that a market is ranging or consolidating.
Traders often use the ADX in combination with other technical indicators to confirm trend signals and identify potential entry and exit points. For example, a trader might use the ADX along with moving averages to determine the strength of a trend and decide when to enter or exit a trade.
In summary, the ADX is a powerful tool in technical analysis that can help traders identify trends and make informed trading decisions. By understanding the calculation of the ADX and its importance, traders can effectively use this indicator to improve their trading strategies.
ADX, or Average Directional Index, is a technical indicator that is used to measure the strength of a trend. It is often used in conjunction with other indicators to confirm a trend and make decisions about buying or selling assets.
When the ADX is below 20, it generally indicates a weak and indecisive trend. This means that the market is not exhibiting a strong directional movement and there is a lack of clarity in terms of whether the price will continue to move in the same direction or reverse. Traders and investors may interpret this as a time of consolidation or sideways movement, where the market is range-bound and lacking a clear trend.

During periods when the ADX is below 20, it is often recommended to avoid making large trading decisions based solely on this indicator. Traders may choose to use additional indicators or tools to help confirm trends or wait for the ADX to rise above 20 before making decisions. This can help mitigate the risk of making incorrect predictions or entering trades prematurely.
It is important to note that the interpretation of the ADX will vary depending on the individual trader’s strategy and the market conditions. Therefore, it is always recommended to conduct thorough analysis and consider multiple factors before making trading decisions.
ADX stands for Average Directional Index. It is a technical indicator used in trading to measure the strength and direction of a trend in the market.
ADX is calculated using a series of calculations involving the positive and negative directional movement of an asset over a specified period of time. The formula for ADX calculation is quite complex and involves smoothing techniques and mathematical calculations.
If ADX is below 20, it suggests that the market is in a non-trending or ranging state. It means that there is no strong trend in either direction and the market is moving sideways. Traders may interpret this as a lack of trading opportunities and may consider staying out of the market until a clear trend emerges.
ADX below 20 is not a specific buy or sell signal. It simply indicates a lack of strong trend in the market. Traders should use other technical indicators or analysis methods to make buy or sell decisions. It’s important to consider other factors such as support and resistance levels, market volatility, and overall market conditions before making any trading decisions.

Where to Exchange Currency in Kuala Lumpur Kuala Lumpur, the capital city of Malaysia, is a vibrant metropolis known for its modern skyscrapers, rich …
Read Article
How much is 1,000,000 Korean Won to Indian Rupees? Are you planning a trip to India from South Korea? Or do you have any other reason to convert …
Read Article
Euro Rate in ANZ Are you planning to travel to Europe or make purchases in euros? Knowing the current exchange rate is crucial for making informed …
Read Article
What is OAT in banking? In today’s rapidly evolving banking industry, technology has become an indispensable part of every aspect of operations. One …
Read Article
What is the amount of Nigeria’s foreign reserve? The foreign exchange reserve of Nigeria is an important indicator of the country’s economic health …
Read Article
SPX Weekly Options: Here’s What You Need to Know When it comes to trading options, understanding the different types available is crucial. One such …
Read Article


