


Is XM Broker Legal in India? - Find out the Legitimacy of XM Broker in India
Is XM broker legal in India? XM Broker is a popular online trading platform that offers a wide range of financial instruments, including forex, …
Read Article
In the world of stock trading and technical analysis, there are various chart patterns and indicators that can provide valuable insights into market trends. One such pattern is the tweezer top, which often occurs during bullish market trends. Understanding the significance of tweezer tops can be crucial for traders and investors looking to capitalize on upward price movements.
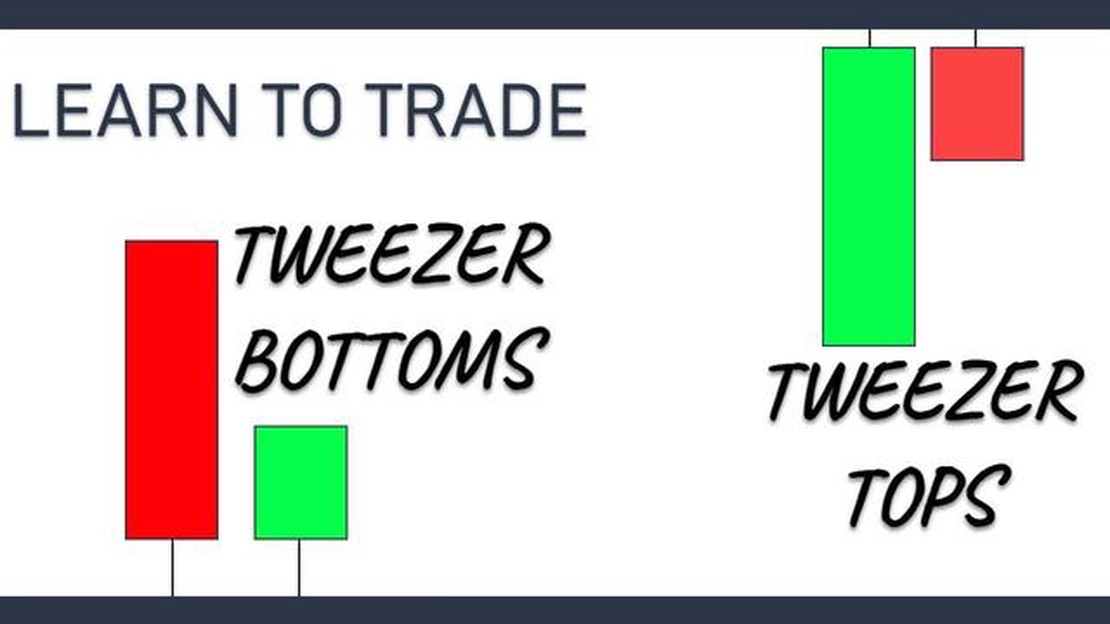
A tweezer top is a candlestick pattern that consists of two or more candlesticks with equal or near-equal highs. The pattern forms when the market reaches a high point, but encounters resistance and fails to break through to new highs. This can signal a potential reversal or a temporary halt in the upward trend. Traders often interpret tweezer tops as a bearish signal, indicating that buying pressure is weakening and that a price correction may be imminent.
When identifying tweezer tops, it is important to consider the overall market context and other technical indicators. The pattern is typically more significant when it occurs after a prolonged upward trend, as it suggests a possible exhaustion of buying pressure. Additionally, traders often look for confirmation signals such as bearish candlestick patterns or a decline in trading volume to support their analysis.

While tweezer tops can indicate potential reversals or corrections, it is important to note that they are not infallible indicators. Market conditions can be complex and unpredictable, and it is crucial to consider other factors and indicators before making trading decisions. Nevertheless, keeping an eye out for tweezer tops in bullish market trends can provide valuable insights and help traders stay ahead of potential price reversals.
Tweezer tops are a significant chart pattern in bullish market trends. They are formed when two consecutive candlesticks have equal (or almost equal) highs, which create a horizontal resistance level. This pattern indicates a potential reversal of the current trend and a shift from bullish to bearish sentiment.
Traders and investors pay close attention to tweezer tops as they can provide valuable insights into market dynamics. Here’s why they are important:
Read Also: Understanding an IB Agreement: Everything You Need to Know
It’s important to note that while tweezer tops can provide valuable insights, they are not foolproof indicators. Traders should always use them in combination with other analysis techniques and tools to make well-informed trading decisions.
In conclusion, understanding the significance of tweezer tops in bullish market trends can help traders identify potential trend reversals and make more profitable trading decisions. By recognizing the formation of this pattern and considering its implications, traders can enhance their overall market analysis and increase their chances of success.
Tweezer tops are a popular candlestick pattern that can provide valuable insights into a bullish market trend. This pattern occurs when two consecutive candlesticks have the same high price, forming a horizontal line on a price chart. The first candlestick in the pattern is typically bullish, indicating buying pressure, while the second candlestick is bearish, suggesting a potential reversal in the trend.
The name “tweezer tops” comes from the fact that the two candlesticks resemble a pair of tweezers, with their upper shadows aligning at the same level. This pattern forms when there is a struggle between the bulls and bears, with the bulls initially pushing the price higher and then the bears driving it back down.
Tweezer tops are often seen as a sign of market exhaustion and a potential reversal point. Traders use this pattern to identify areas of resistance and potential selling opportunities. When tweezer tops are observed at significant levels of support or resistance, they can carry even more significance.
It’s important to note that tweezer tops should not be used as a standalone signal for making trading decisions. They should be confirmed by other technical indicators or patterns before taking any action. Additionally, it’s crucial to consider the overall market context and other factors that may impact price movements.
Overall, understanding the significance of tweezer tops in bullish market trends can help traders make more informed decisions and improve their trading strategies. By recognizing these patterns and combining them with other analysis techniques, traders can gain a deeper understanding of market dynamics and enhance their trading success.
A tweezer top is a candlestick pattern that occurs during an uptrend and it indicates a potential reversal. It consists of two consecutive candlesticks with similar highs, indicating that the buying momentum is losing strength.
Read Also: Is Trading 212 profitable? Understanding the potential profitability of Trading 212
To identify a tweezer top pattern, look for two consecutive candlesticks with similar highs. The candlesticks can have different lengths and colors, but their highs should be very close to each other.
A tweezer top pattern in a bullish market trend signifies a potential reversal. It indicates that the buying momentum is losing strength and that the market might start to move in the opposite direction. Traders often use the tweezer top pattern as a signal to sell or take profits.
The reliability of the tweezer top pattern depends on various factors, such as the market conditions and the timeframe in which it appears. The pattern tends to be more reliable when it occurs after a prolonged uptrend and when it is confirmed by other technical indicators or chart patterns.

Other candlestick patterns that are similar to the tweezer top pattern include the shooting star and the bearish engulfing pattern. These patterns also indicate a potential reversal in an uptrend and are often used by traders to make trading decisions.
A tweezer top is a candlestick pattern formed by two consecutive candlesticks with almost the same high, indicating a potential reversal in a bullish market trend.

Is XM broker legal in India? XM Broker is a popular online trading platform that offers a wide range of financial instruments, including forex, …
Read Article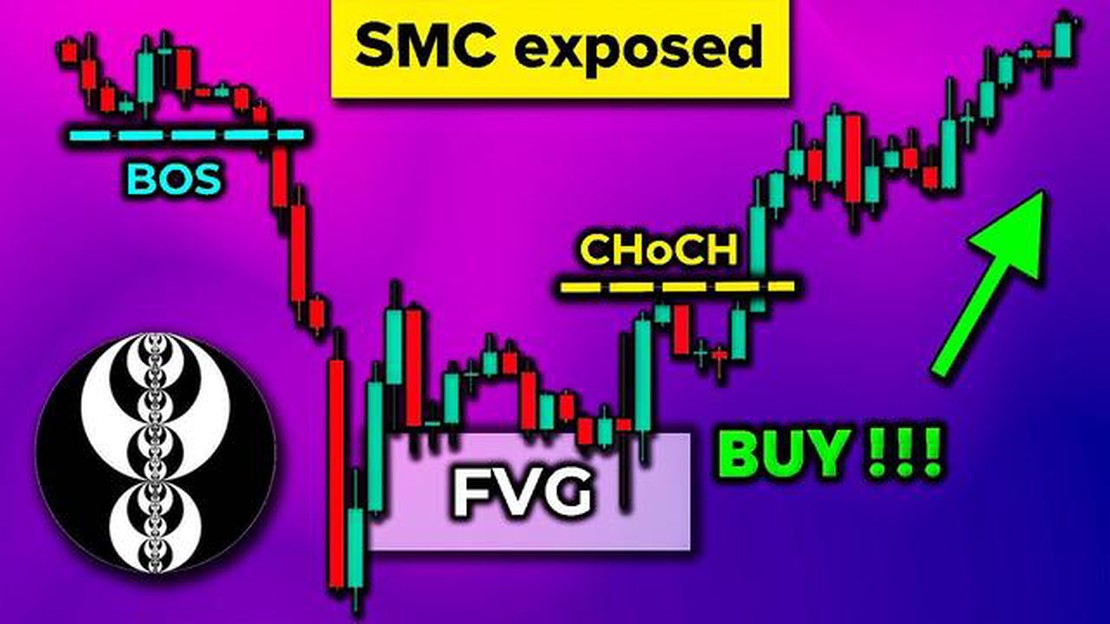
Understanding SMC Strategy in Trading If you’re interested in the world of trading, you’ve probably come across the term SMC strategy. But what …
Read Article
ACF vs PACF: Understanding the Difference Autocorrelation Function (ACF) and Partial Autocorrelation Function (PACF) are important tools in the field …
Read Article
How to Qualify for Foreign Exchange at Nedbank If you’re planning to travel abroad or conduct business with international partners, it’s important to …
Read Article
Current price of 1 oz of gold in Australian dollars Are you interested in investing in gold? Knowing the current price of gold in Australian dollars …
Read Article
When Do Futures Options Settle? Futures options are a popular investment tool that allow traders to capitalize on the price movements of various …
Read Article


